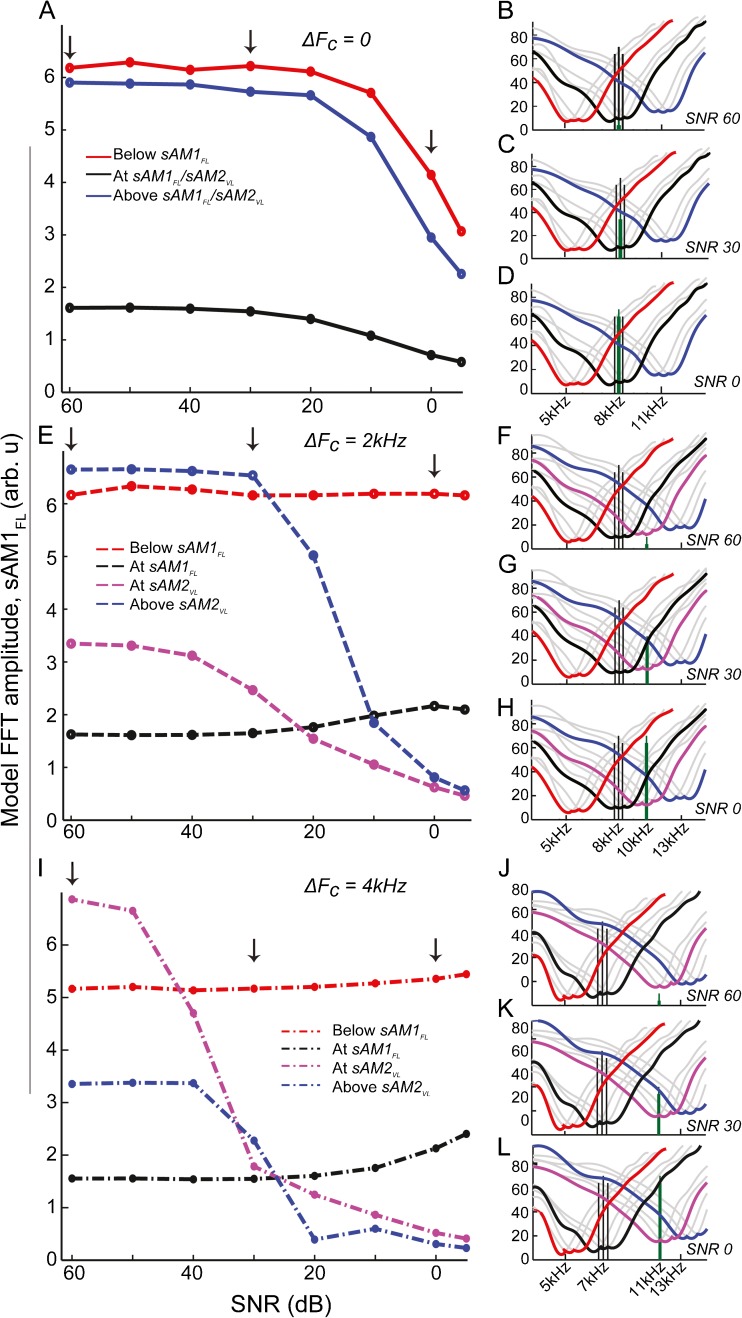
Fig. 6.
Trends seen in EFRs are due to the contributions of low-frequency tails of high-frequency neurons. The RIGHT COLUMN shows stimuli represented by four frequency regions made up of three neurons of consecutive CFs tested (see “methods” section). Individual frequency response areas of the neurons are in GRAY. Combined frequency regions are outlined for “below sAM1FL” (RED), “at sAM1FL” (BLACK), “at sAM2VL” (MAGENTA), and “above sAM2VL” (BLUE). A–D do not contain magenta, as Fc of sAM1FL = F C of sAM2VL. sAM1FL stimuli are represented as BLACK VERTICAL LINES and sAM2VL as GREEN VERTICAL LINES. Tuning curves were generated using only high SR neurons for illustrative purposes. X-AXES show frequency in kHz, and Y-AXES show sound level in dB SPL. The LEFT COLUMN shows combined model FFT amplitudes for sAM1FL, for the four frequency regions, across all the SNRs, for the three test conditions. X-AXES represent SNR in dB, and Y-AXES represent comparative mean model FFT amplitude (arbitrary units).

