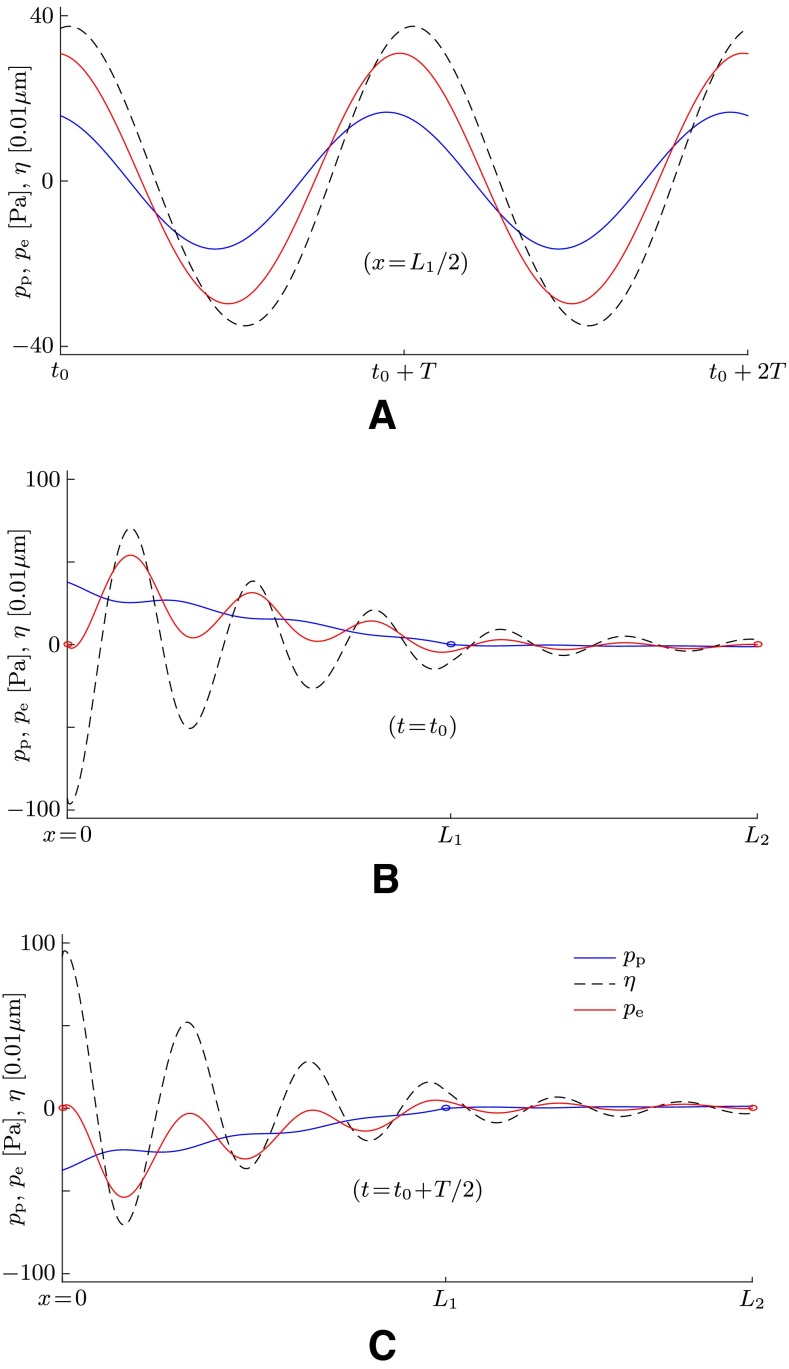
FIG. 6.
Simulation results for the perilymph pressure p p (blue lines), the membrane displacement η (dashed lines), and the endolymph pressure p e (red lines) for a sound stimulus with f = 1 kHz. The membrane stiffness is set to E = 40 kPa, and the perilymph velocity amplitude is set to U p = 2.6 mm/s at x = 0. A Time series for two successive sound periods T at quasi-periodic steady state at the axial location x = L 1/2. B, C Snapshots at two distinct points in time plotted along x. The blue circles indicate the zero-pressure boundary condition for the perilymph at the location of the SCD (x = L 1); the red circles indicate the zero-pressure boundary condition for the endolymph at the openings towards the utricle (x = 0 and x = L 2).

