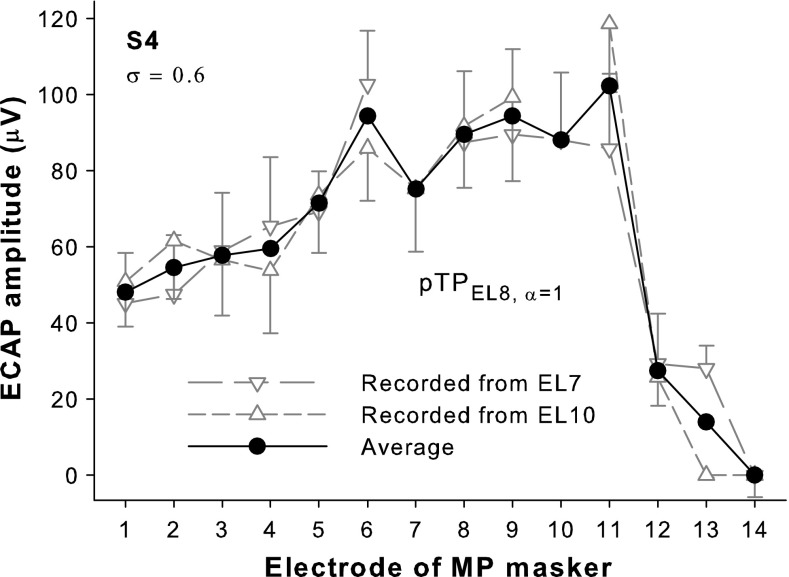
FIG. 2.
ECAP amplitude as a function of masker electrode for pTPEL8, α = 1 with σ = 0.6 in S4 recorded from EL10 (upward triangles) and EL7 (downward triangles), and then averaged (circles). Error bars represent the 95 % confidence intervals of the ECAP amplitudes measured over 128 repeats and are only shown in one direction for clarity of presentation.

