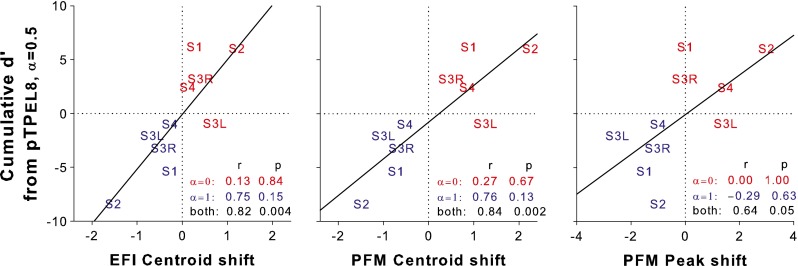
FIG. 9.

Cumulative d′ from pTPEL8, α = 0.5 to pTPEL8, α = 0 (in red) or to pTPEL8, α = 1 (in blue) as a function of the corresponding EFI centroid shift (left panel), PFM centroid shift (middle panel), and PFM peak shift (right panel). The solid lines indicate the linear regression between the pitch-ranking sensitivity and pattern shift for both pTPEL8, α = 0 and pTPEL8, α = 1.
