
Figure 1.
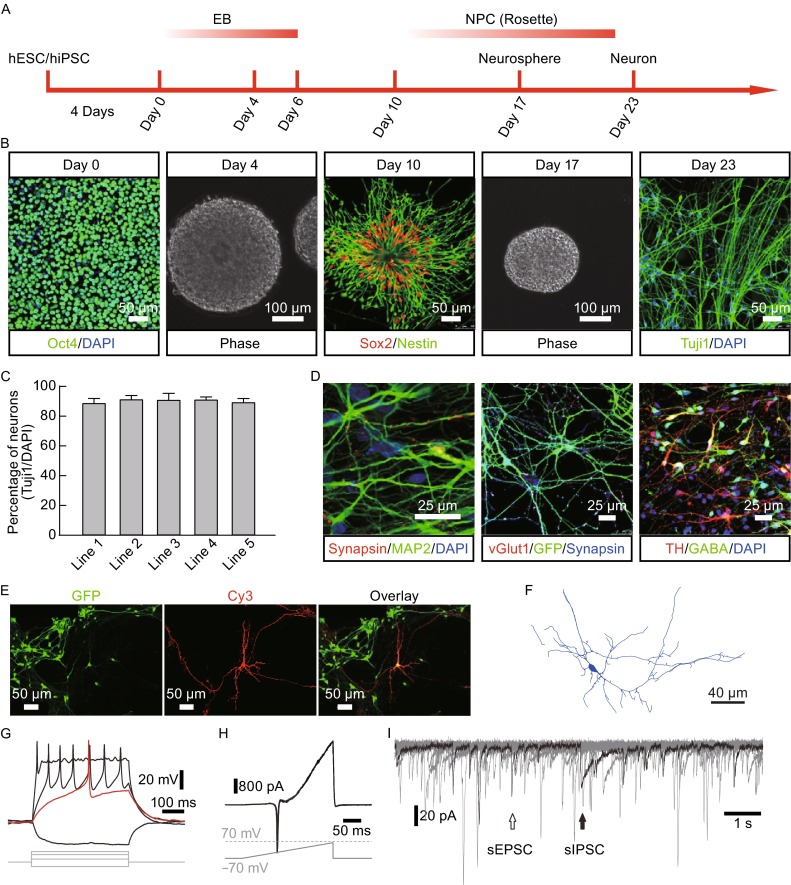
Generation of functional neuron via differentiation of hESC/hiPSC/fetal tissue-derived NSCs. (A) Diagram of the neuronal differentiation protocol (see experimental procedures for details). (B) Representative images showing morphological changes during neural differentiation. hESC/hiPSC are positive for pluripotent markers Oct4. Neural stem/progenitor cell (NSC/NPC) colonies, showing rosette structures, are positive for neural precursor markers Sox2 and Nestin, whereas neurons are positive for Tuj1 (Bar: 100 or 50 μm). (C) Percentage of Tuj1 positive cells showing similar pan neuronal differentiation potentials of different hESC/hiPSC lines. (D) Representative images of mature neurons, co-cultured with mouse astrocytes, showing expression of MAP2, Synapsin, vGlut1, TH, and GABA (Bar: 25 μm). (E) Representative images of a recorded neuron injected with neurobiotin and immunostained (Cy3), surrounded by other GFP expressing lentivirally infected neurons. Bar represents 50 μm. (F) A representative reconstructed image of neurons. Scale bar represents 40 μm. (G) Representative action potential responses of a hiPSC-derived neuron evoked by current injection (Bars: 100 ms and 20 mV). (H) Representative traces from a hiPSC-derived neuron showing inward sodium currents and outward potassium currents in response to a ramp protocol (from −70 mV to +70 mV). Three super imposed traces are shown (Bars: 50 ms and 800 pA). (I) Representative traces from a hiPSC-derived neuron showing spontaneous postsynaptic currents (sPSCs). Ten traces are superimposed. Black arrow, inhibitory sPSC; white arrow, excitatory sPSC (Bars: 1 s and 20 pA)