
Figure 2.
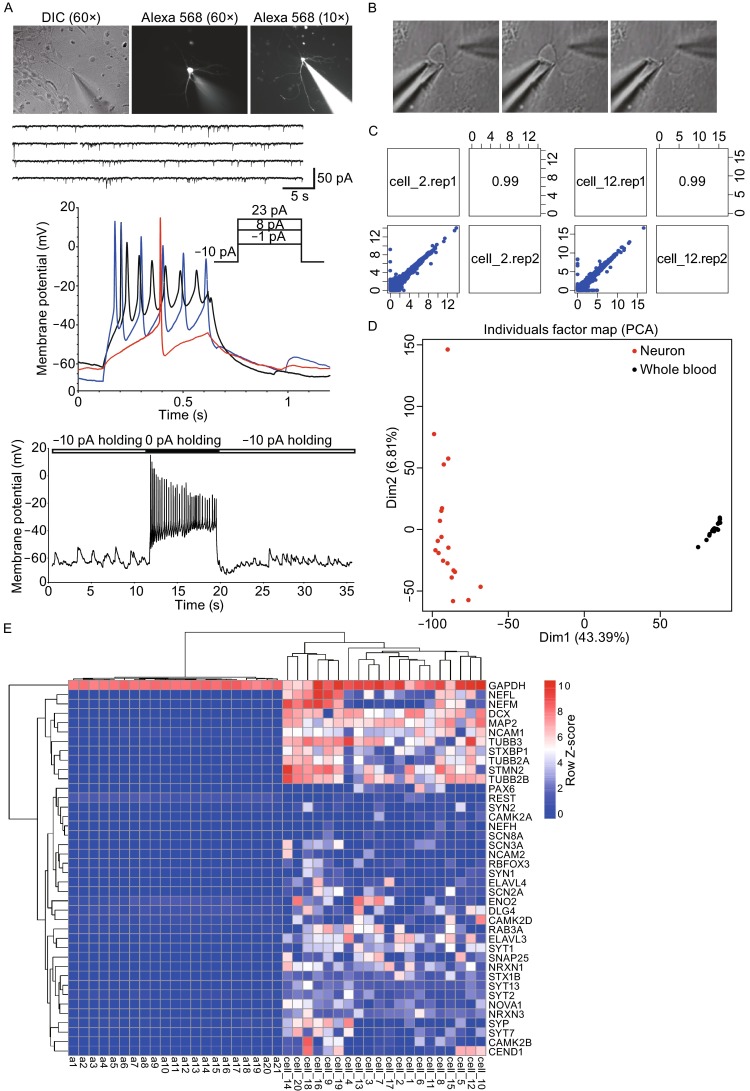
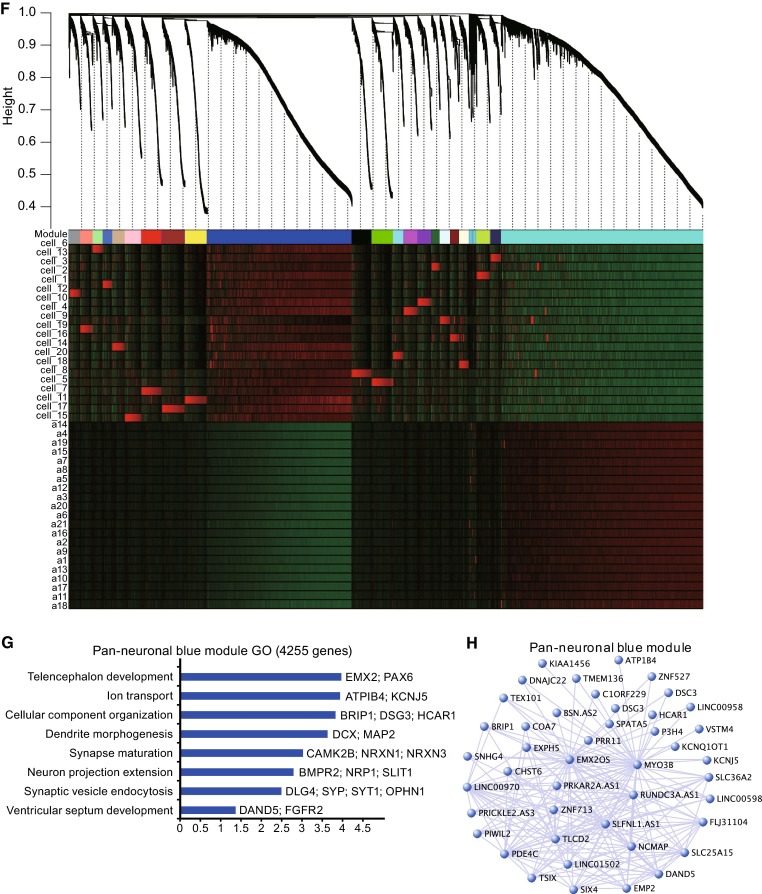
Single cell transcriptome analyses reveal neuronal property of collected target cells. (A) A representative patch-clamp recording of a H9 hESC-derived neuron. This neuron was filled with Alexa Fluor 568 hydrazide during whole-cell patch clamping to reveal the morphology (middle and right in top panel). Spontaneous postsynaptic currents were recorded through voltage-clamp mode (middle top panel). Short-term (0.5 s, middle top panel) and long-term (8 s, bottom panels) recordings of action potentials were performed with stepwise current injection through current-clamp mode. (B) Micromanipulator-assisted manual collection of single neurons showing moments of target cell entering the patch pipette, before (left), during (middle), and after (right) the entry. All soma and majority of dendritic parts were collected. (C) Technical replica of two single-cell transcriptome (Cell_2 and Cell_12) were subjected to two independent sequencings in two batches. High similarity between two replicates (Pearson correlation coefficient = 0.99) indicates minimum sequencing batch effect, hence the robustness and accuracy of our sequencing technology. (D) PCA of single-cell transcriptomes including neuron and peripheral blood samples suggested that neurons were distinct from peripheral blood cells. (E) Pan-neuronal genes were exclusively expressed in neurons but not blood samples. (F) Gene clustering of all 20 single cells and 21 blood samples (a1–a21) revealed a neuronal specific gene module (blue module). (G) GO analyses of the blue module (4255 genes). Length of bars indicates the significance (−log10 transferred P-value, Fisher’s exact test). Genes shown in right are well-known genes with corresponding functions. (H) Hub-gene network of the blue module