
Figure 3.
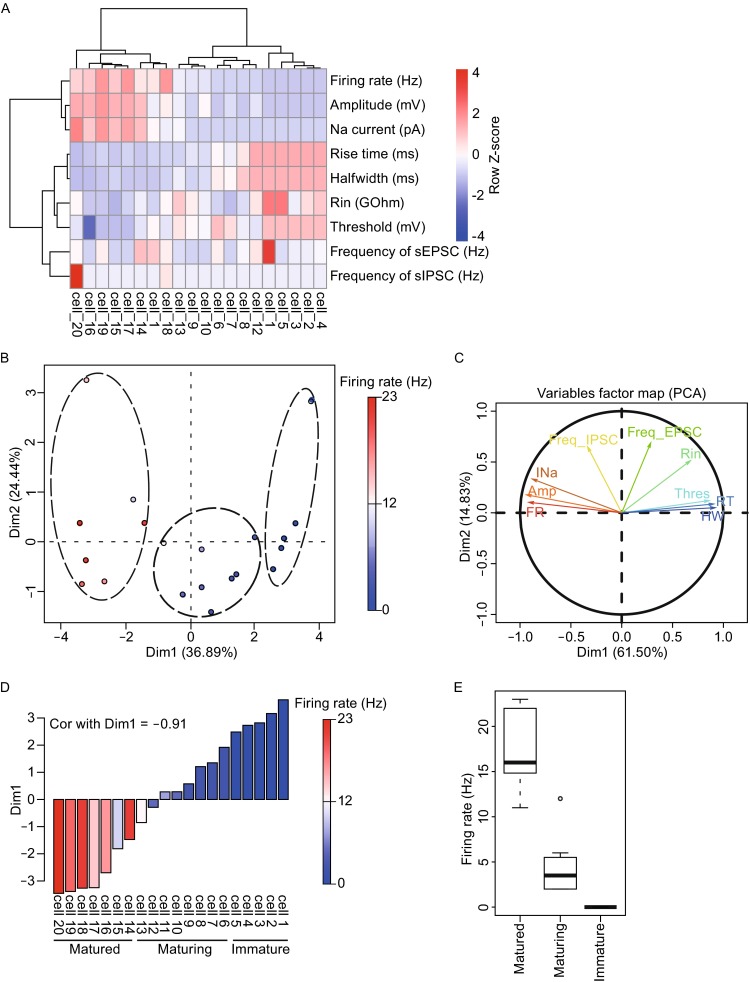
Electrophysiological phenotypes of neurons revealed three groups of neurons based on their maturity. (A) AP and sPSC electrophysiological parameters indicated different maturation stages of 20 single neurons. (B) PCA revealed dimension 1 as an indication of maturity and split 20 neurons into three groups. Colors of each circle correspond to different firing rate of the neurons, which is a highly regarded parameter for neuronal maturity. (C) Variable factor map revealed the correlation vector of each electrophysiological parameter with dimension 1 and dimension 2. Arrow tip denotes correlation coefficient of the respective parameter with each PC. Abbreviation, Thres. (Threshold); Freq_EPSC. (Frequency of sEPSC); RT. (Rise time); HW. (Halfwidth); Freq_IPSC. (Frequency of sIPSC); INa. (Na current); Amp. (Amplitude); FR. (Firing rate). (D) High absolute value of Pearson correlation coefficient (−0.91) between Dim1 and firing rate, indicating Dim1 is highly anti-correlated with neuron maturation. (E) Firing rate of three groups of neuron