
Figure 4.
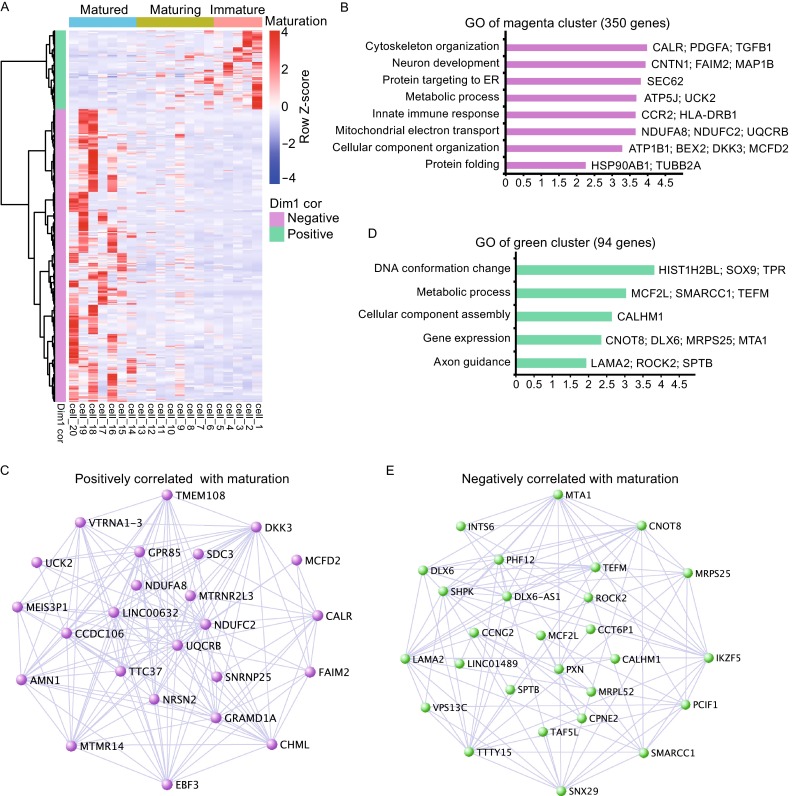
Single cell transcriptome analysis revealed maturation-related genes. (A) Expression of genes positively (green cluster) and negatively (magenta cluster) correlated to dimension 1 of electrophysiological parameters (Correlation > 0.4 and P < 0.05, Student correlation P-values) in 20 single neurons. (B) GO analyses of genes negatively correlated to dimension 1 (magenta cluster, 350 genes), enriched in mature neurons. Length of bars indicated the significance (−log10 transferred P-value, Fisher exact test). (C) Hub-gene network of the magenta gene cluster. (D) GO analyses of genes positively correlated with dimension 1 (green cluster, 94 genes), enriched in immature neurons. Length of bars indicated the significance (−log10 transferred P-value, Fisher exact test). (E) Hub-gene network of the green gene cluster