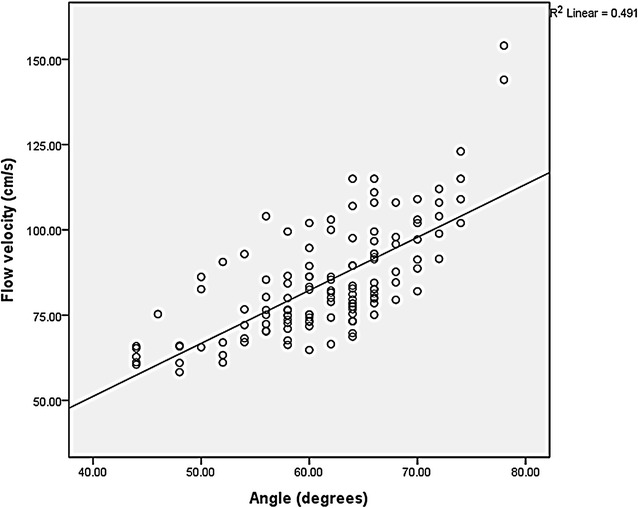
Fig. 5.

Scatter plot with line fit of flow velocity and angle shows a significant linear correlation (P = 0.000, R2 = 0.491) between beam-flow angle and PSV, with PSV overestimation progressively increased as beam-flow angles increased even with Doppler angle correction
