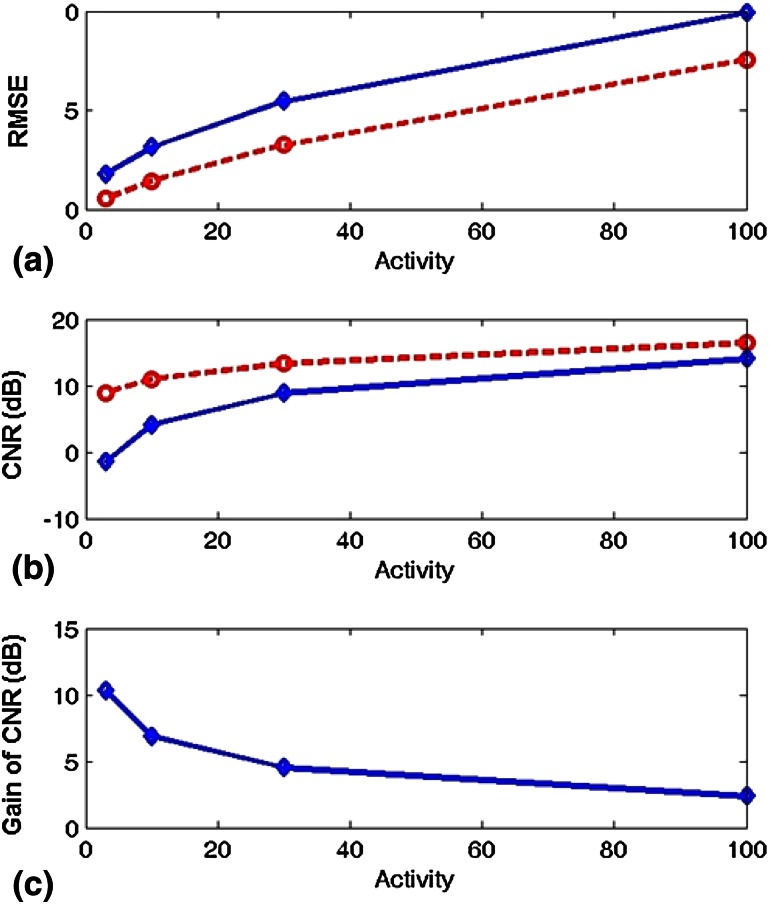
Fig. 7.
Quantitative comparisons. a Plots of RMSE for pinhole images (solid line) and reconstructed CA images (dashed line) with four different simulated radioactivities, b plots of CNR for pinhole images (solid line) and reconstructed CA images (dashed line), and c illustration of CA improvements over pinhole in terms of CNR

