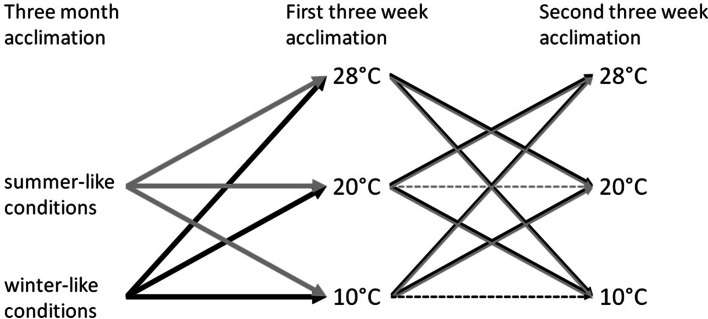
Fig. 1.
Outline of the acclimation procedure used during winter and summer experiments. The lines indicate how animals were moved between ambient temperatures during winter (black lines) and summer (gray lines) experiments. Dashed lines represent individuals kept as a control groups during summer (gray) and winter (black) experiments. See text for the detailed description

