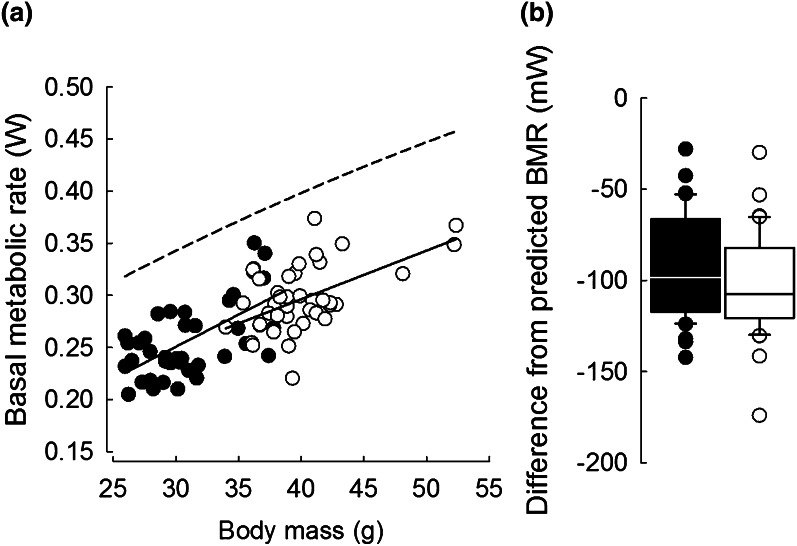
Fig. 2.
a Relationships between basal metabolic rate and body mass in hamsters acclimated to winter- (black) and summer-like (white) conditions. Dashed line indicates basal metabolic rate predicted by body mass following Lovegrove (2000). b Deviation from allometrically predicted values of BMR in hamsters acclimated to winter- (black) and summer-like (white) conditions. Line median, box 25–75 %, whiskers 10–90 %. Note different scales on each plot

