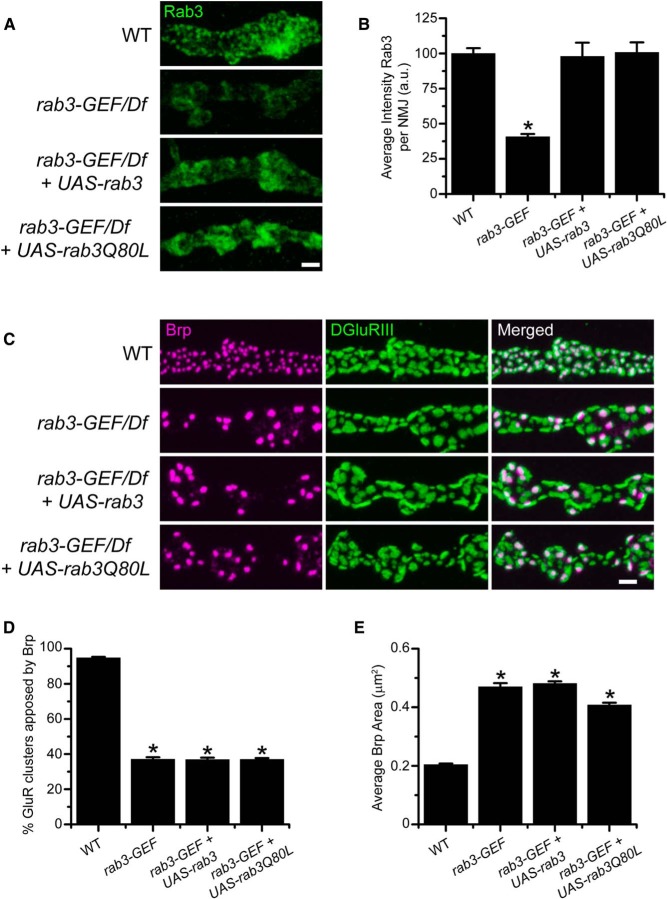
Figure 8.
Transgenic expression of WT Rab3 or a GTP-locked variant of Rab3 increases Rab3 accumulation at the NMJ but fails to rescue Brp distribution in the rab3-GEFSC225 mutant. A, Images of NMJs immunostained with α-Rab3 (green) from WT (dvglutNMJX-Gal4/+), the rab3-GEFSC225 mutant (dvglutNMJX-Gal4, rab3-GEFSC225/Df(1)ED7289), the rab3-GEFSC225 mutant expressing UAS-rab3 (dvglutNMJX-Gal4, rab3-GEFSC225/Df(1)ED7289;; UAS-rab3/+), and the rab3-GEFSC225 mutant expressing UAS-rab3Q80L (dvglutNMJX-Gal4, rab3-GEFSC225/Df(1)ED7289;; UAS-rab3Q80L/+). Scale bar, 2 µm. B, Histogram shows the average intensity of α-Rab3 signal throughout the entire NMJ for the genotypes listed in A. n = 10 NMJs for all genotypes; *p= 6.7 × 10⁻⁷t versus WT, 1.35 × 10⁻⁶t versus the rab3-GEF mutant expressing UAS-rab3, and 5.12 × 10⁻⁷t versus the rab3-GEF mutant expressing UAS-rab3Q80L. C, Images of NMJs costained with α-Brp (magenta) and α-DGluRIII (green) from the genotypes listed in A. Scale bar, 2 µm. D, E, Histograms show (D) the average percentage of DGluRIII clusters apposed to Brp puncta per NMJ and (E) the average area of individual Brp puncta for the genotypes listed in A. n = 10 NMJs for all genotypes; (D) *p≪0.000001u versus WT; (E) *p≪0.000001v versus WT.

