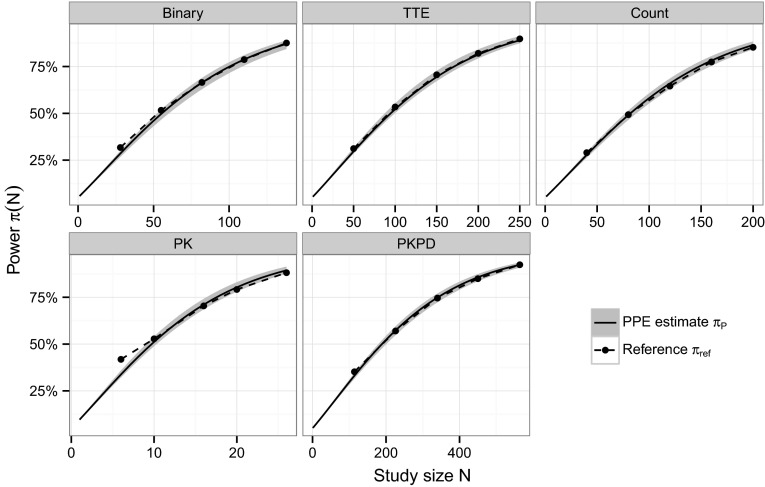
Fig. 1.
Power versus sample size curves from the parametric power estimation (PPE) algorithm in comparison with the reference power. The solid black line indicates the median and the gray band represents the 95 % confidence band of the PPE-based power from 1000 runs of the algorithm using 400 Monte Carlo samples. The reference power is indicated by black dots

