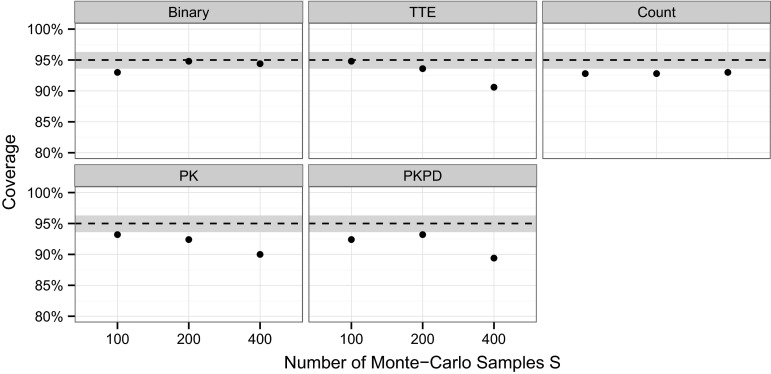
Fig. 2.
Coverage of the 95 % confidence intervals generated with the parametric power estimation (PPE) bootstrap procedure (shown as black dots) for different models and with different Monte Carlo sample sizes. The dashed lines indicate the nominal confidence level and the gray bar the uncertainty associated with running 1000 repetitions

