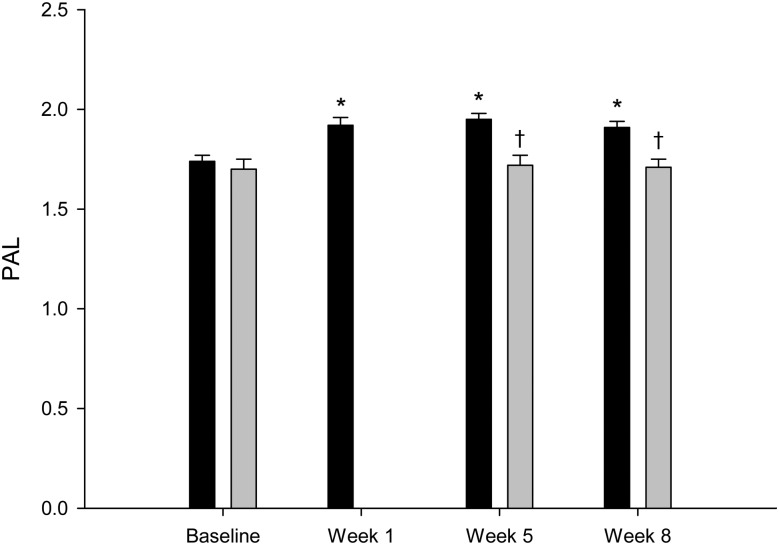
Fig. 2.
Physical activity level (PAL) in the intervention group (■; n 46) and in the control group (▒; n 10). Values are means, with standard errors represented by vertical bars. * Mean value was significantly different from that at baseline (P < 0·05). † Mean value was significantly different from that of the intervention group (P < 0·05).

