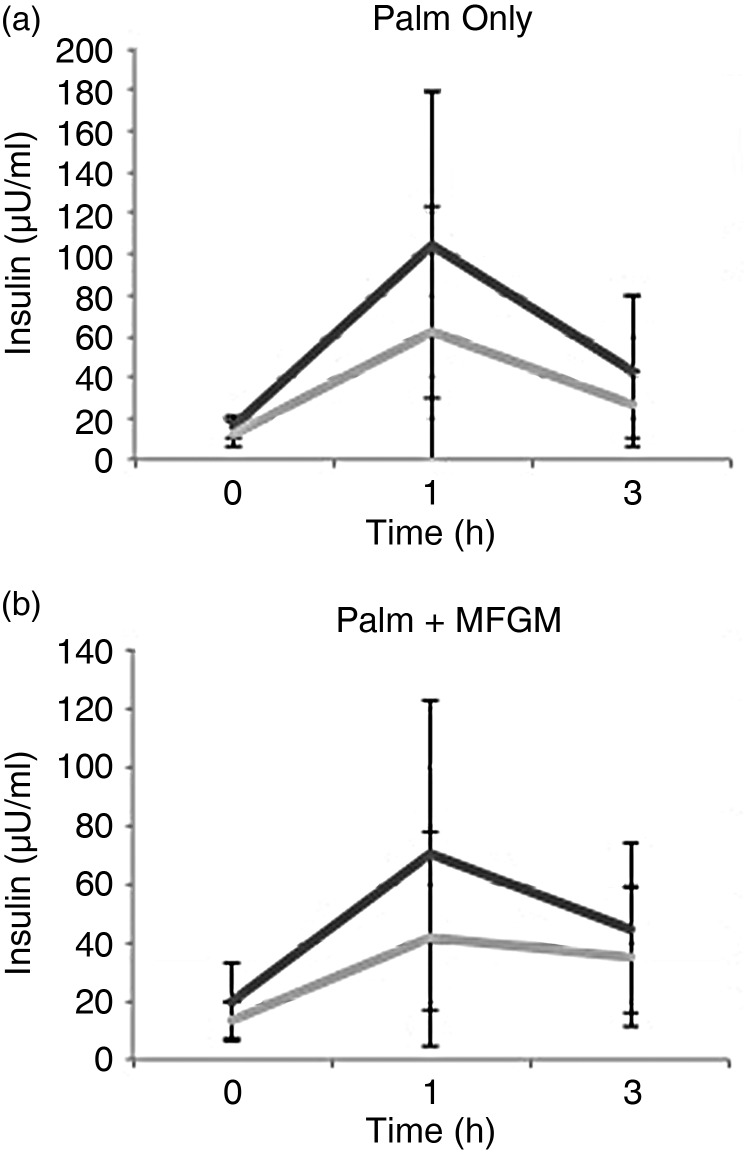
Fig. 3.
Insulin concentrations in high (––) v. low (––) baseline C-reactive protein (CRP) groups. (a) There was a significant difference between the high and low baseline CRP groups at the 1 h time point (P = 0·03) after consuming the palm oil meal. (b) When the palm oil + milk fat globule membrane meal was consumed there was no difference between the high and low baseline CRP groups for insulin. Values are means, with standard deviations represented by vertical bars. To convert insulin to pmol/l, multiply by 6·945.

