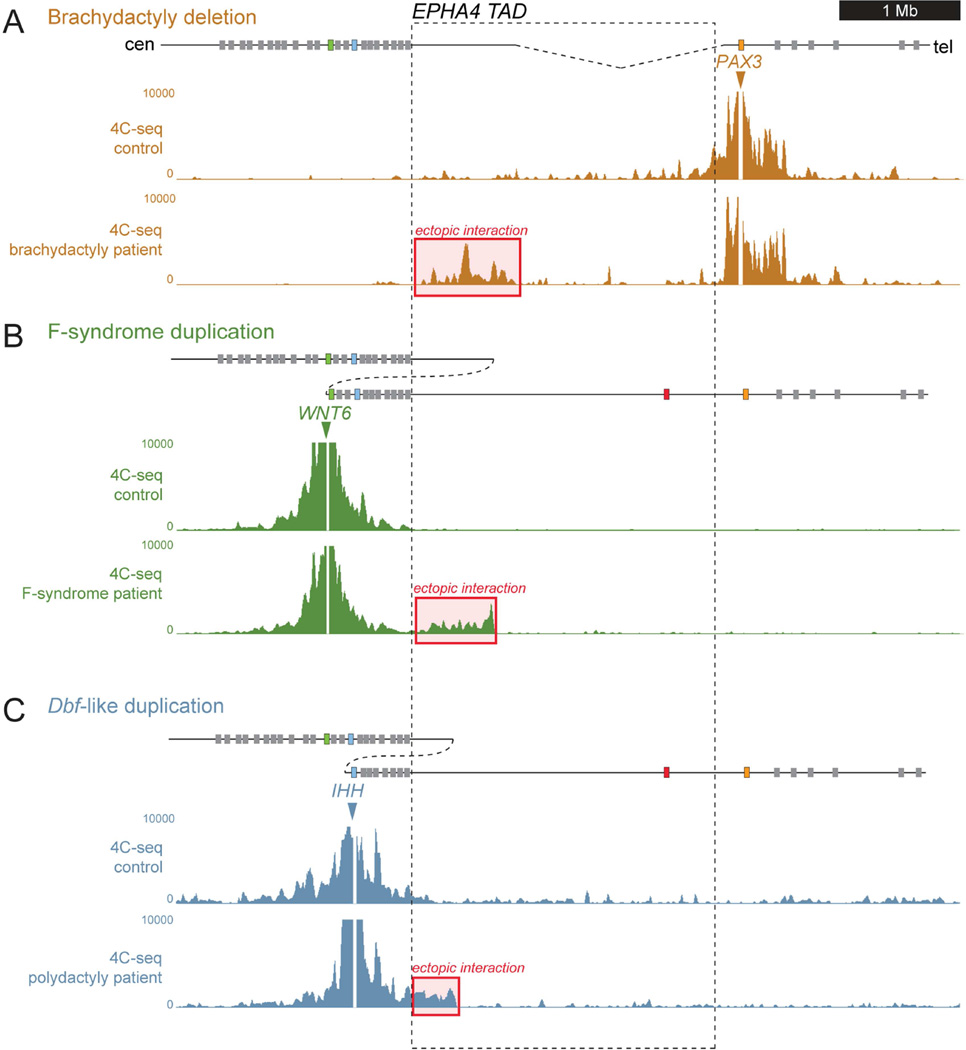
Figure 4. 4C-seq analysis in patient-derived human adult fibroblasts.
Schematic representation of the locus and the structural variations are shown on top. 4C-seq profiles from human adult fibroblasts from healthy controls and patients with heterozygous structural variations are shown below. Red boxes indicate ectopic interaction. The EPHA4 TAD is indicated by dashed lines. (A) Patient with brachydactyly- associated deletion. 4C-seq analysis with PAX3 as viewpoint shows extensive ectopic interaction with the EPHA4 TAD (red box). (B) Patient with the F-syndrome-associated duplication. 4C-seq profile with WNT6 as viewpoint shows ectopic interaction with the EPHA4 TAD (red box). (C) Patient with the polydactyly-associated duplication. 4C-seq profile with IHH as viewpoint shows ectopic interaction with the centromeric region of the EPHA4 TAD (red box).

