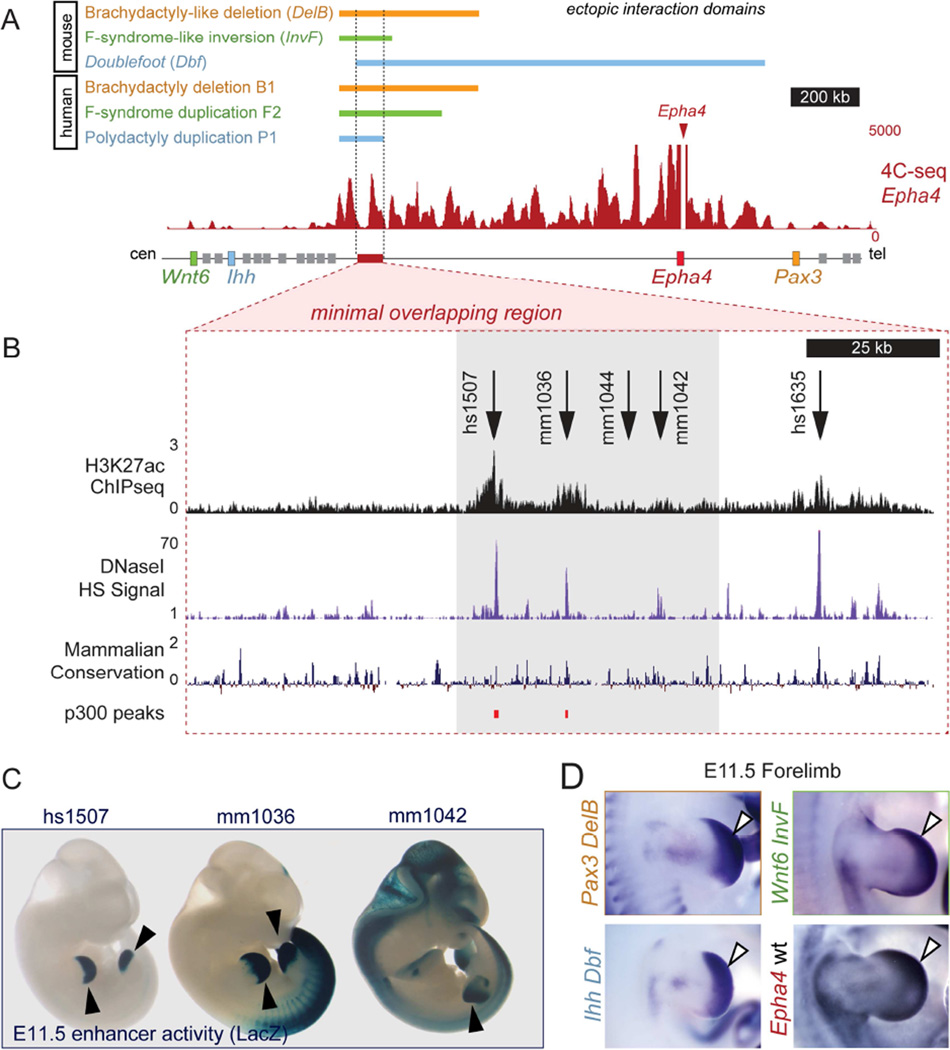
Figure 5. A cluster of limb enhancers is located in the interacting region of the EphA4 TAD.
(A) Color bars indicate the fragment of the Epha4 TAD showing increased interaction with target genes in different mouse mutant limbs or human patient fibroblasts. The 4C-seq profile of Epha4 in E11.5 distal mouse limbs is shown for comparison. Red box indicates region of minimal overlap analyzed for enhancer activity. (B) Close-up view of the chromosomal region analyzed. DNase HS, H3K27ac and p300 ChIP-seq from E11.5 limbs and conservation tracks were used to predict enhancers. Arrows indicate putative enhancer regions. Gray box indicates the location of a cluster of enhancers shown below (C). (C) Transgenic enhancer reporter (LacZ) staining at E11.5. (D) Pattern of forelimb expression of Pax3 (DelB), Wnt6 (InvF), and Ihh (Dbf) in mutants and endogenous pattern of expression of Epha4 by in situ hybridization at E11.5. Note the similarity of endogenous Epha4 and ectopic Pax3, Wnt6, and Ihh expression domains (D, white arrows) with the enhancer activity patterns (C, black arrows). See also Figures S5 and S6.

