Figure 4.

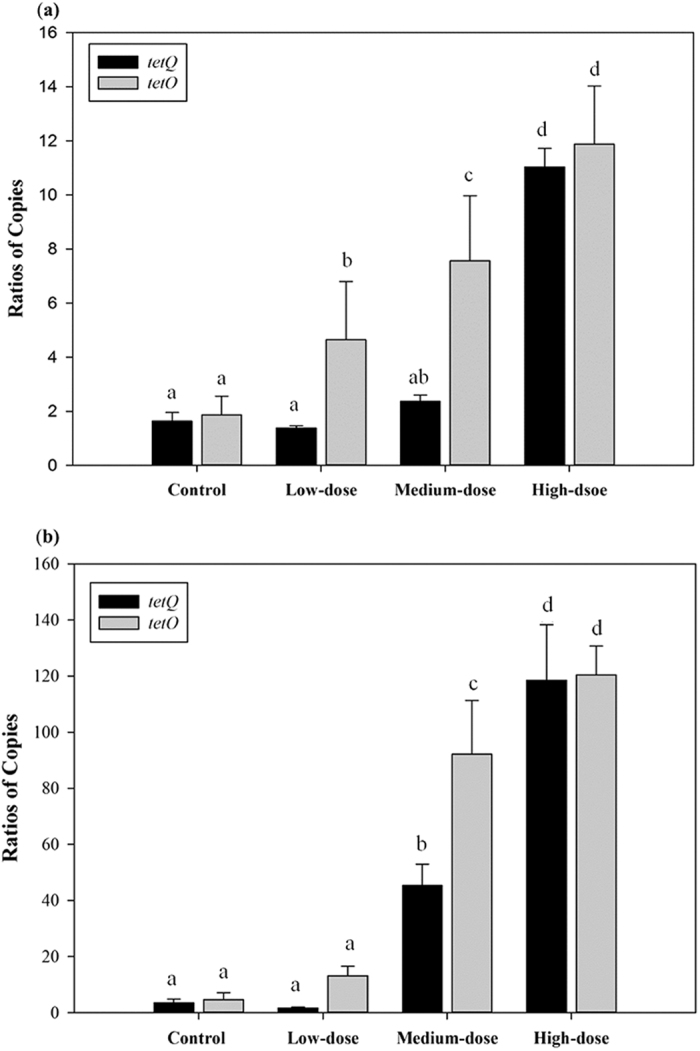
Relative abundances of the genes tetQ and tetO obtained from qPCR in the males (a) and females (b) of the four groups at day 16. All data are presented as the mean ± SE. Different letters designate significant difference (p < 0.05).

Relative abundances of the genes tetQ and tetO obtained from qPCR in the males (a) and females (b) of the four groups at day 16. All data are presented as the mean ± SE. Different letters designate significant difference (p < 0.05).