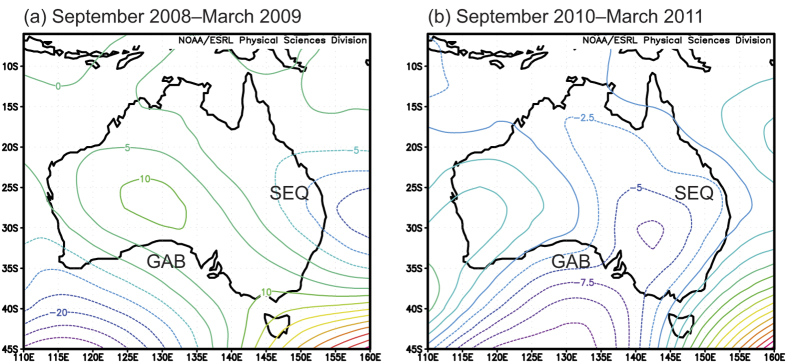
Figure 4.
Seasonal weather patterns during (a) a very dry period (September 2008–March 2009) and (b) the land sink anomaly in Australia (September 2010–March 2011). Contours represent monthly average 500 hPa geopotential height above (solid lines) and below (dashed lines) the zonal average, in which negative values are indicative of low pressure and enhanced vorticity. The locations of southeast Queensland (SEQ) and the Great Australian Bight (GAB) are shown for reference. Maps were obtained from the NCEP/NCAR reanalysis project (monthly mean geopotential heights, http://www.esrl.noaa.gov/psd/cgi-bin/db_search/SearchMenus.pl).

