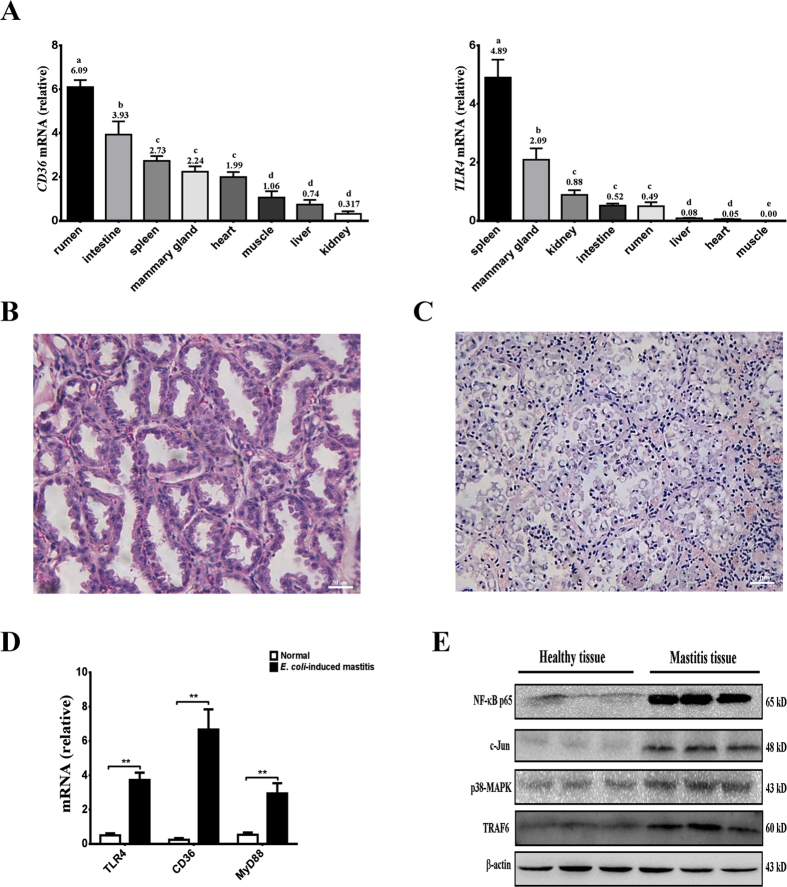
Figure 1. Distribution of CD36 and TLR4 expression in various tissues from dairy goats following E. coli-induced mastitis.
(A) Relative distribution of CD36 and TLR4 mRNA expression in different goat tissues. The relative expression values are shown on the top of each bar. (B,C) Histology of the dairy goat mammary gland. In healthy dairy goats, epithelial tight junctions, intact acinar structures, and no infiltrated inflammatory cells are observed in the mammary tissue of the uninfected udder (B, left). Acinar epithelial cells and inflammatory cells infiltrated the acinar lumina, causing interstitial edema, and the acinar structures disintegrated in E. coli-induced mastitis (C, right). (D) Relative to the healthy dairy goat, the mRNA expression of CD36, TLR4, and MyD88 increased significantly in E. coli-infected goats (**P < 0.01). (E) NF-κB, c-JUN, p38-MAPK, and TRAF6 protein levels were enhanced in mastitis tissues compared to health tissues. The values are the means ± SEM for three individuals. Quantitative PCR data were normalized to GAPDH, UXT, and MRPL39.

