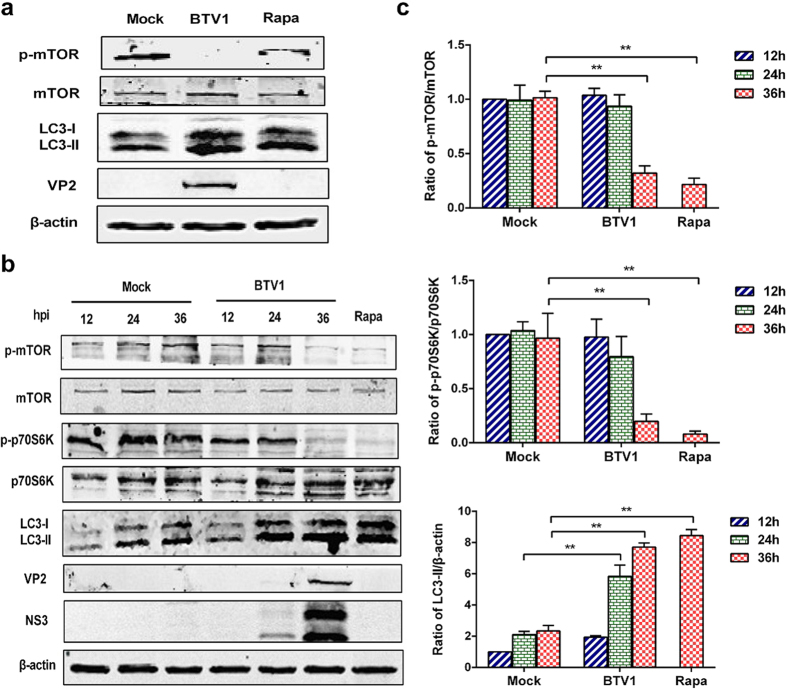
Figure 1. BTV1 induces autophagy by suppressing the mTOR signaling pathway.
(a) BSR cells were infected with BTV1 (MOI = 1) or mock-infected or treated with 100 nM rapamycin (Rapa, positive control) for 36 h. Western blotting was performed using the indicated antibodies. (b) BSR cells were infected as above, and at different time points (12, 24 and 36 hpi), cells were harvested and analyzed by western blotting using the indicated antibodies. BSR cells treated with 100 nM Rapa for 36 h were used as a positive control. (c) Bar graphs showed the relative abundances of phosphorylated mTOR (p-mTOR), p-p70S6K and LC3-II protein (normalized to corresponding total protein or β-actin). A mock infection of 12 h was set at 1.0. The values represent the mean ± SD from three repeats. Statistical significances were analyzed using Student’s t-test (**P < 0.01).

