
Figure 5. Box-and-whisker plots for hourly measurement of exhaled NO at 50 mL s−1 of three volunteers in three days (from 8:00 a.m. to 9:00 p.m.).
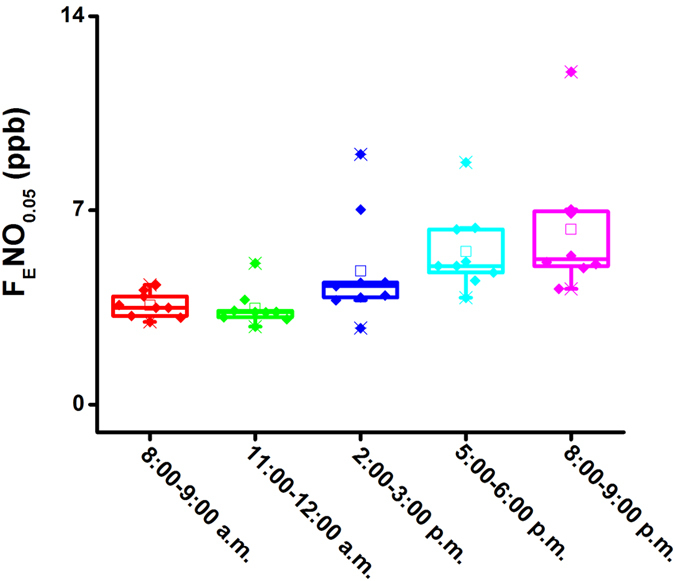
Box-and-whisker plots: the bottom and top of the box present the first and third quartile, respectively; the band inside the box is always the second quartile (the median); lines extending vertically from the boxes (whiskers) stand for the upper and lower extreme (the highest and lowest number in a set of data) and also indicate the variability outside the upper and lower quartiles.