
Figure 2.
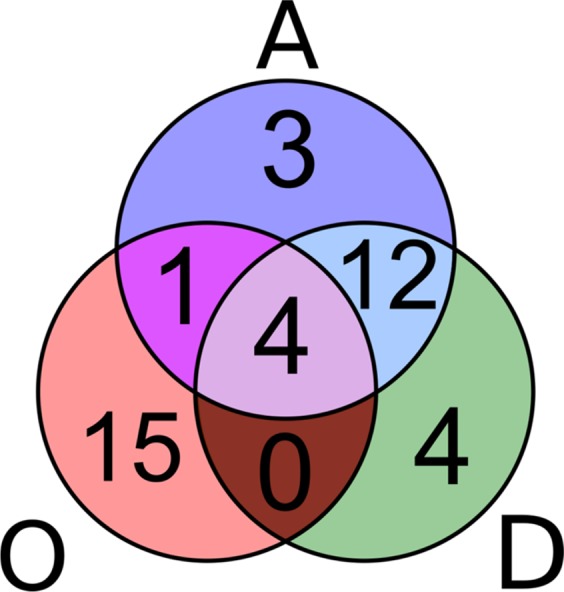
Venn diagram of the three considered sets of the top 39 metabolites: most occurring (O), most reported as tested for activity (A), and most distinct (D) activities. The activities/distinct activities set are highly overlapping, whereas the occurrence set tends to be isolated from these.