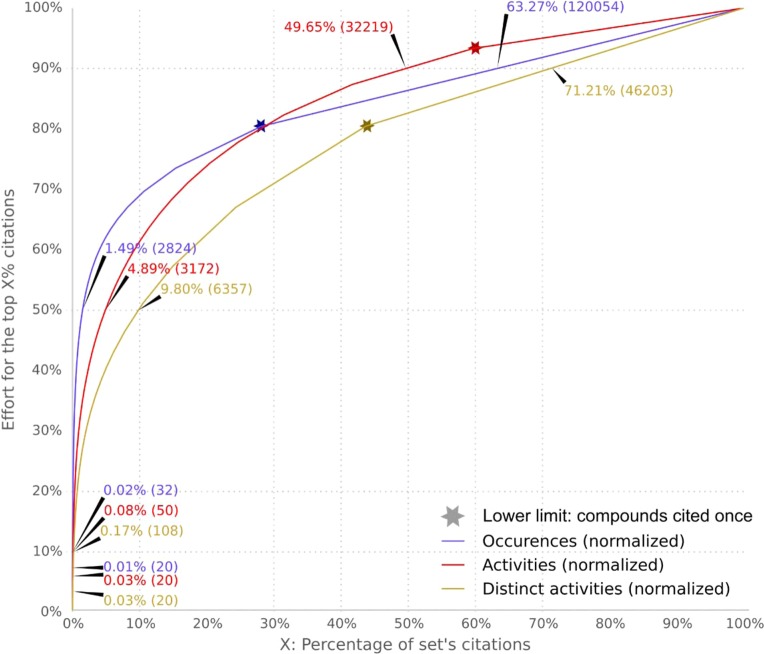
Figure 4.
Cumulative sums of the distributions of the three top-20 sets of NPs: occurrences (O) in blue, activities (A) in red, and distinct activities (D) in brown. The arrows show the percentage of citations at each given point, as well as the number of citations (in parentheses) that represent the top-20 NPs (bottom left), as well as the top 10% (lower left), top 50% (middle), and top 90% (upper right) of all NPs. The stars indicated the beginning of the single citation per compound zone, which continues on the right, ending at 100%.

