
Figure 5.
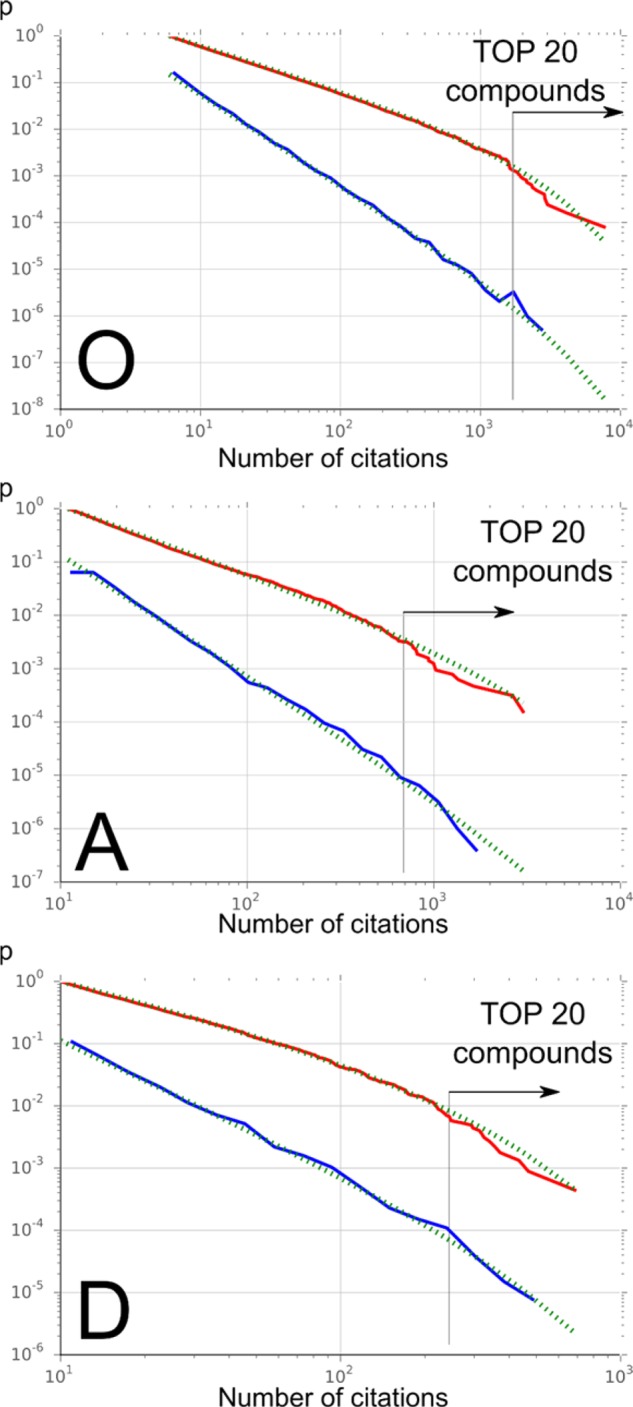
Truncated power-law fitting of the distributions (blue) and cumulative sums (red) of the three sets: occurrences (O), activities (A), and distinct activities (D). These graphics represent the cumulative complementary density functions, representing the probabilities (y-axis) of obtaining a given value (x-axis). They clearly show that low-citation compounds (left) are more likely to happen than high-citations ones (right). Dotted green lines are the truncated power-law fitting according to eq 1.