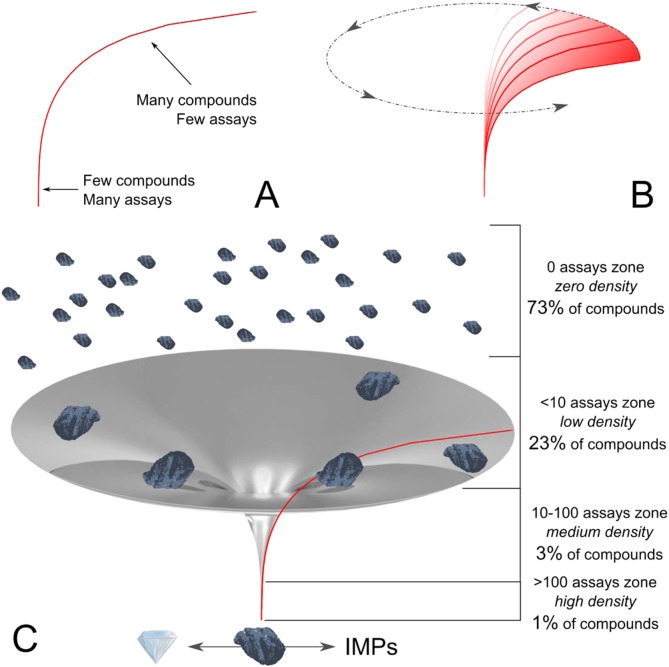
Figure 6.
Cumulative abundances of the reporting of the occurrences, activities, and distinct activities all follow the same principal power-law distribution. A typical curve is shown in A, indicating the two major regions of overattention to a few and lack of effort on many NPs. Distributing this NP–abundance–bioactivity space, which was built on the base of NAPRALERT’s nearly 200,000 compounds, into the third dimension (B) generates a hyperbolic structure that resembles a well-known corpus in astrophysics and is, therefore, termed the black hole of NPs. Panel C shows its various zones that categorize all NPs by their attached biological knowledge and abundance of the test parameter (O/A/D; see main text). Similar to a stellar black hole, density (representing research effort) increases dramatically toward the bottom (with infinite effort not being a scientific option). In distinction to its true counterpart, the black hole of NPs has a (virtual) outlet toward the bottom (C), which release either precious hits or IMPs.

