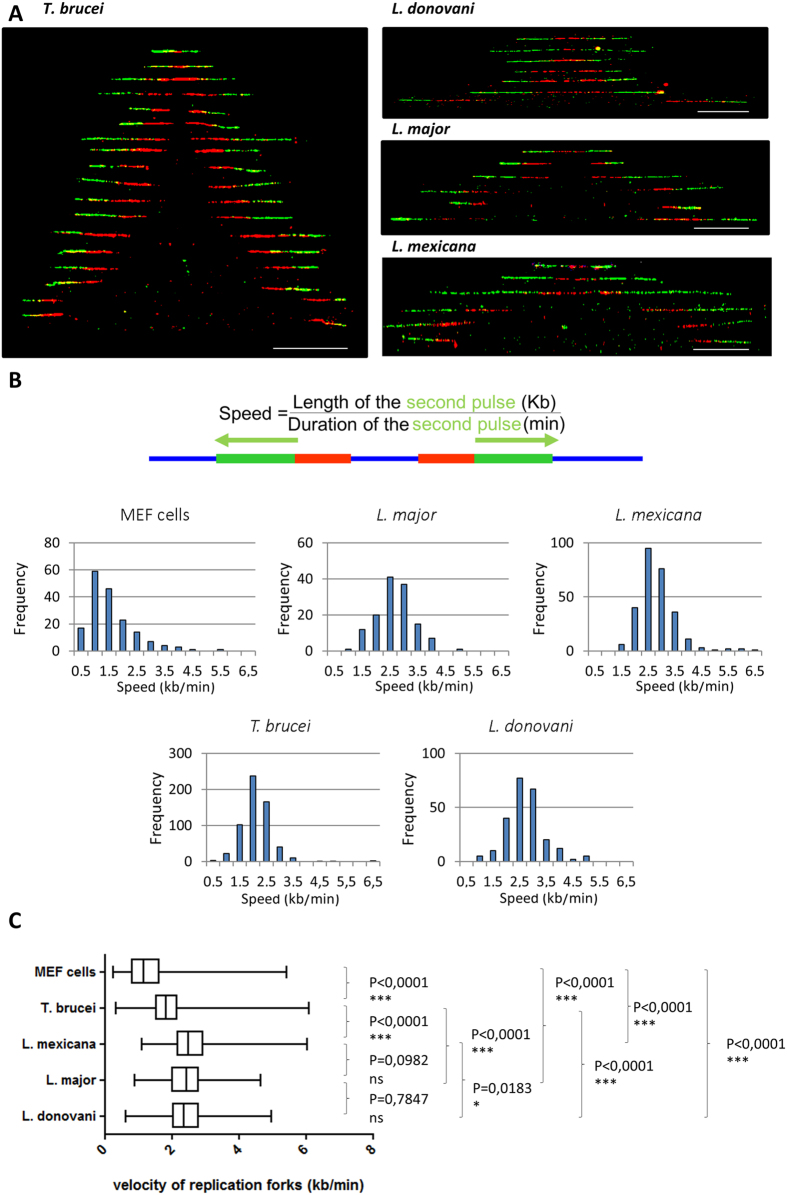
Figure 3. Single-molecule analysis of the velocity of replication forks in MEF cells and four trypanosomatids using DNA molecular combing.
(A) Representative bidirectional replication forks taken from different microscopic fields were artificially assembled and centred on the position of the presumed origins. Red tracks: IdU, green tracks: CldU. Counterstaining of DNA was performed but is not shown here for the sake of clarity. Scale bar: 50 kb. (B) Statistical distribution of replication forks velocity measurements in MEF cells and four trypanosomatids. The velocity of the replication fork was calculated by dividing the length of the ‘green’ tracks with the duration of the second pulse. (C) Comparative analysis of the velocity of replication forks in the five cell lines obtained after one-way ANOVA analysis of variances. Boxes present 25–75% range. Whiskers present minimum–maximum range. The two-tailed Mann-Whitney test was used to compare the median values of the velocity of replication forks between each two samples and to calculate the corresponding P values (P < 0.05 was taken as significant).

