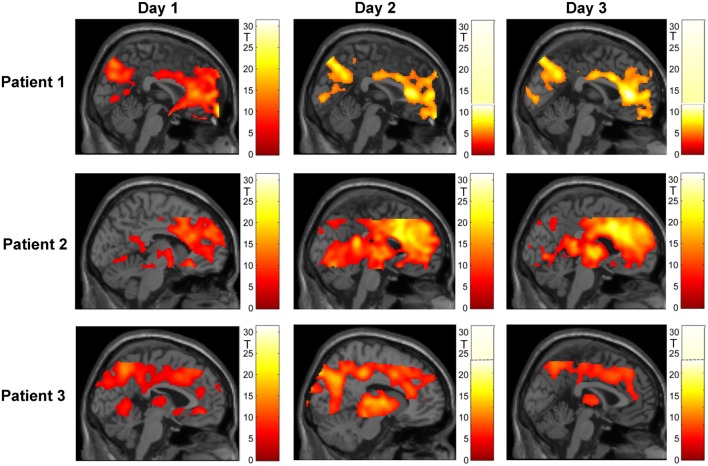
Figure 4.
Regulation during the neurofeedback runs as compared to baseline blocks of counting (p < 0.05, FWE corrected). The activation patterns did not reveal a clear increase in regulation, but the individual clusters appeared more focused on the ACC over the 3 days of neurofeedback training in patients 2 and 3. Please note that absolute T values differ across training days and across patients (adapted color codes). However, the identical thresholds make the cluster sizes directly comparable.

