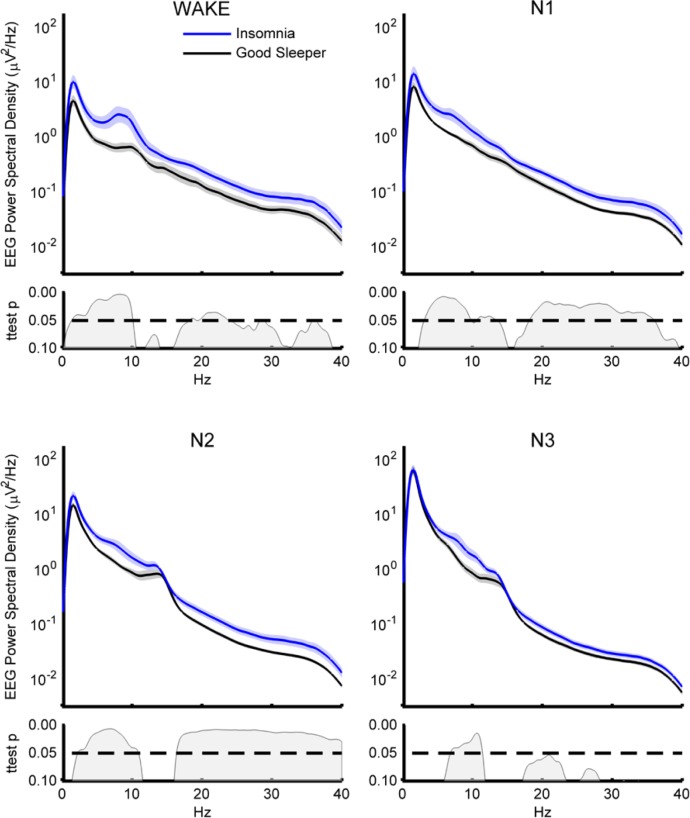
Figure 4.
EEG spectral density by stage. Power spectral density and P values categorized by sleep stage. Shaded area represents standard error of the mean (SEM). Statistics based on logarithmically normalized data. Wake stage is composed mostly of wake after sleep onset. EEG, electroencephalography.

