Figure 4.
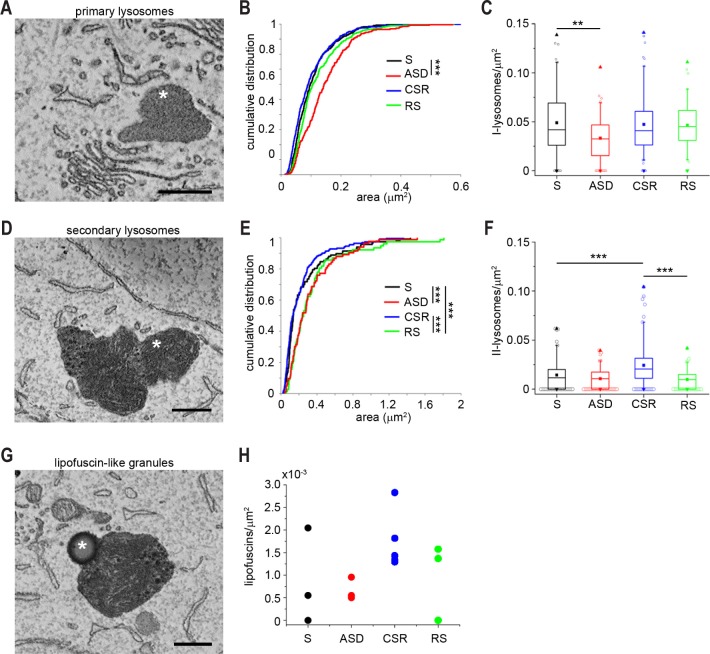
Lysosomal changes due to sleep loss. (A) Micrographs of a primary lysosome (asterisks). (B) Cumulative distribution of the size of primary lysosomes. (C) Box plot showing the density of primary lysosomes across groups. Secondary lysosomes were 117 in S, 83 in ASD, 222 in CSR, and 77 in RS. (D) Micrograph of secondary lysosomes (asterisk). (E) Cumulative distribution of the size of secondary lysosomes. (F) Box plot showing the density of secondary lysosomes across groups. (G) Example of a lipofuscin-like granule. (H) Average density of lipofuscin-like granules in each animal. CSR, chronic sleep restriction; RS, recover sleep; S, sleep; ASD, acute sleep deprivation. Scale bars = 0.5 μm. *P < 0.05, **P < 0.01, ***P < 0.001.

