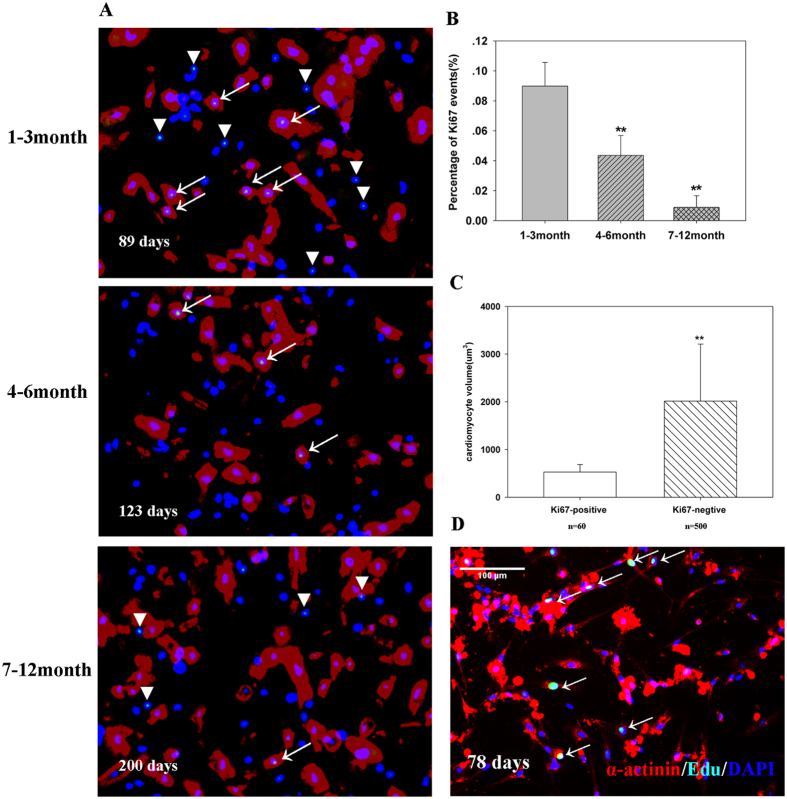
Figure 3. In vitro culture of cardiomyocytes.
(A) Representative graphs of different age groups. Cardiac Troponin T (red), Ki67 (green), and DAPI (blue). Magnification: x10. Arrow indicates proliferating cardiomyocytes, and the triangle indicates non-cardiomyocytes. (B) Quantification of Ki67-positive cardiomyocytes (n = 6). Error bars represent SD. **P < 0.01. (C) The volume of Ki67-positive cardiomyocytes. P < 0.01 (D) After four days of culture, human cardiomyocytes still showed cell cycle activity. Sarcomeric Alpha Actinin (red), EdU (green), and DAPI (blue).

