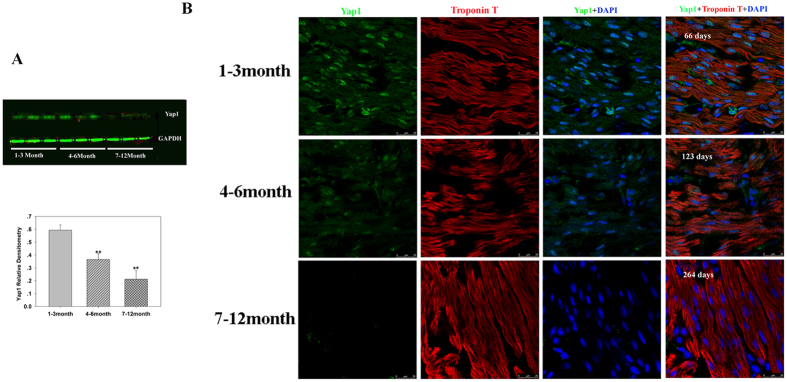
Figure 4. Yap1 expression by Western blot analysis and YAP1 immunofluorescence in tissue sections.
(A) Representative Western blot (top) and mean data obtained by densitometry analysis (bottom) are shown. GAPDH served as a loading control. The bars indicate mean ± SD. ANOVA was performed to evaluate statistical significance of differences, n = 6, **P < 0.01. (B) Representative immunofluorescence in different age groups. Scale bar: 25 μm.

