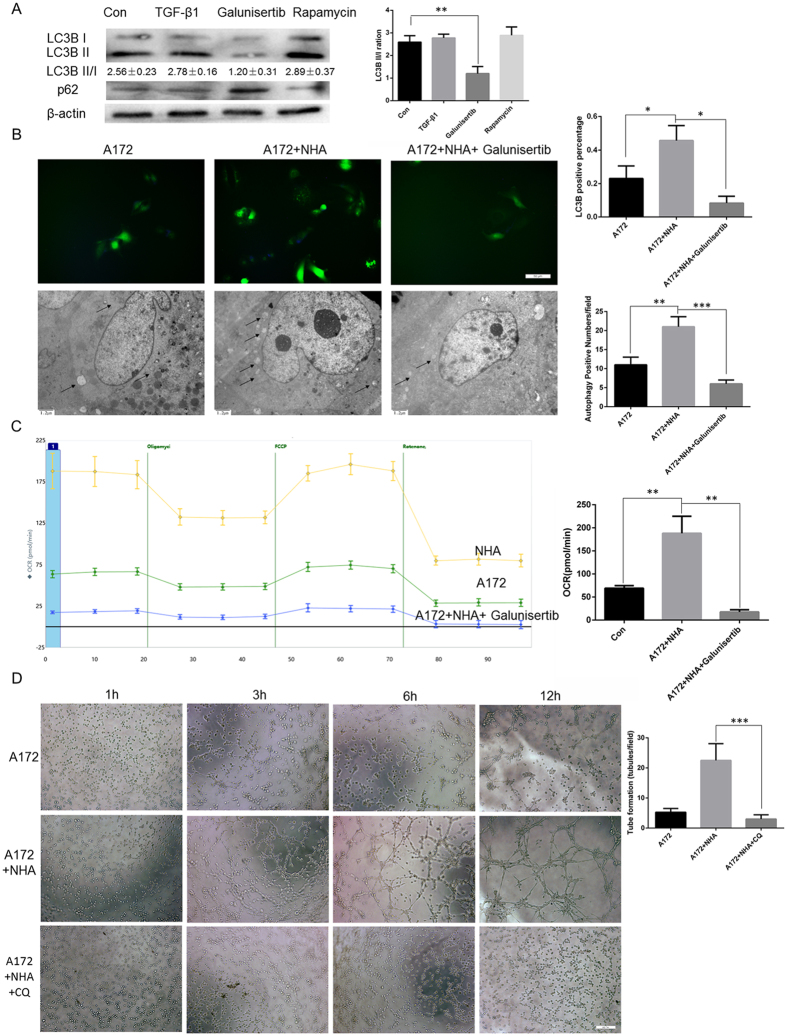
Figure 4. Galunisertib impaired glioma autophagy, which in turn inhibited vasculogenic mimicry.
(A) Western blotting showed that galunisertib suppressed LC3B, an autophagy marker, in A172 cells. (B) Representative images and quantification of immunofluorescence (top, scale bar 50 μm) and transmission electron microscopy (bottom, scale bar 1.2 μm). The number of punctate LC3 structures and of autophagosomes (arrows) were increased in NHA/A172 cells and not in galunisertib-treated cells. (C) Oxygen consumption rate (OCR) was measured by XFe24 with a mito stress kit. Galunisertib lowered metabolic rate. (D) Representative images and quantification of in vitro tube formation assay. Scale bar represents 50 μm. Autophagy inhibition with chloroquine (CQ) inhibited tube formation. Mean ± SEM of three independent experiments; *P < 0.05; **P < 0.01; ***P < 0.001.

