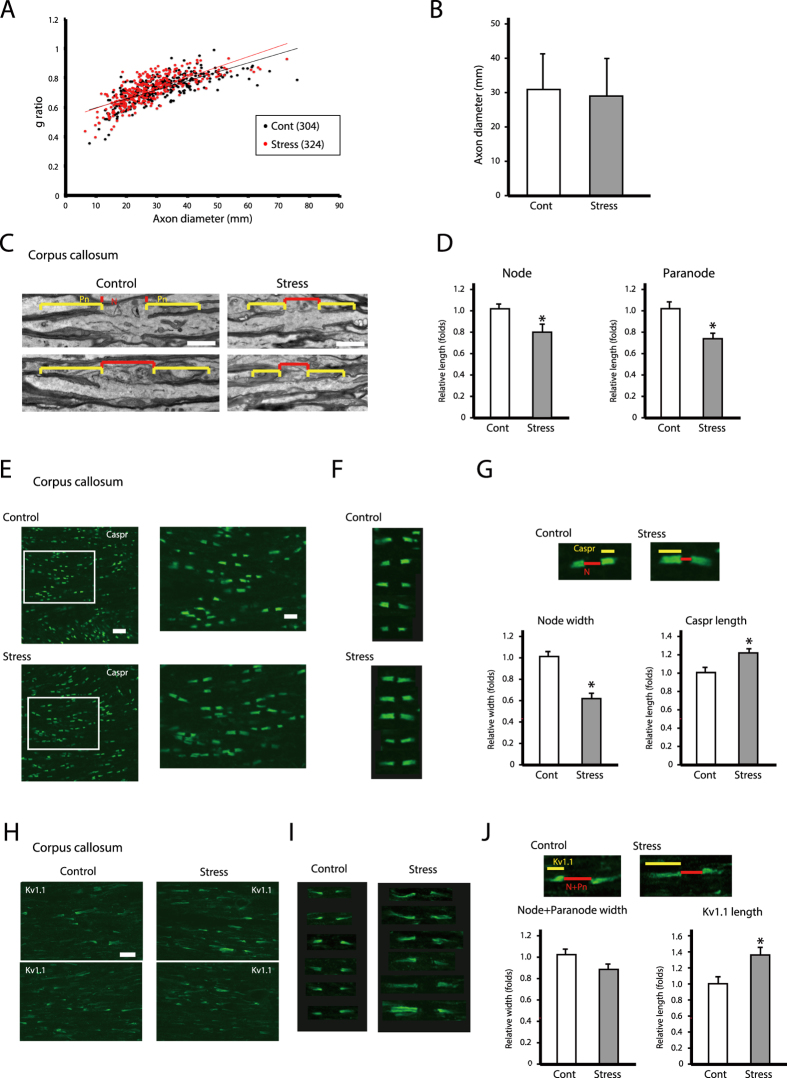
Figure 1. Chronic stress exposure causes morphological alterations in nodes and paranodes of Ranvier of the corpus callosum.
(A) Axon size and myelin thickness measured by g ratio (the ratio of the inner axonal diameter to the total outer diameter). The distribution of the g ratio is plotted as a function of axonal diameter. The results are expressed as the mean of six images (Cont; 304 axons, Stress; 324 axon) obtained from three independent experiments. *P < 0.05, Student’s t test. Cont; non-stressed control mice data, Stress; chronic stress-exposed mice data. (B) The distribution of the axon diameters of the corpus callosum in the control and repeated WIRS-exposed mice was assessed. Results are expressed as the mean of six images (300 nodes of Ranvier) obtained from three independent experiments. The results are expressed as the mean ± SEM. *P < 0.05, Student’s t test. (C) Electron micrographs of nodes (N) and paranodes (Pn) of Ranvier in longitudinal sections of the corpus callosum from control (left panels) and chronically stressed (right panels) mice. Scale bars, 1 μm. (D) Measurement of node width and paranode length. Results are expressed as mean ± SEM of six measurements from three independent experiments. *P < 0.05, Student’s t test. (E,H) Immunohistochemical analyses of Caspr (E) and K v1.1 (H) expression in longitudinal sections of the corpus callosum from control (upper panels) and chronically stressed (lower panels) mice. Scale bar, 20 μm. (F,I) Representative images of Caspr (F) and K v1.1 (I) expression. Scale bar, 5 μm. (G,J) Measurement of node width and the length of Caspr-labeled regions at paranodes (G), and node and paranode width and length of K v1.1-labeled regions at juxtaparanodes (J). Results are expressed as the mean of six images (300 nodes of Ranvier) obtained from three independent experiments. Cas, Caspr-labeled region; N, node region; K v, K v1.1-labeled region; N + Pn, node and paranode region. *P < 0.05, Student’s t test.

