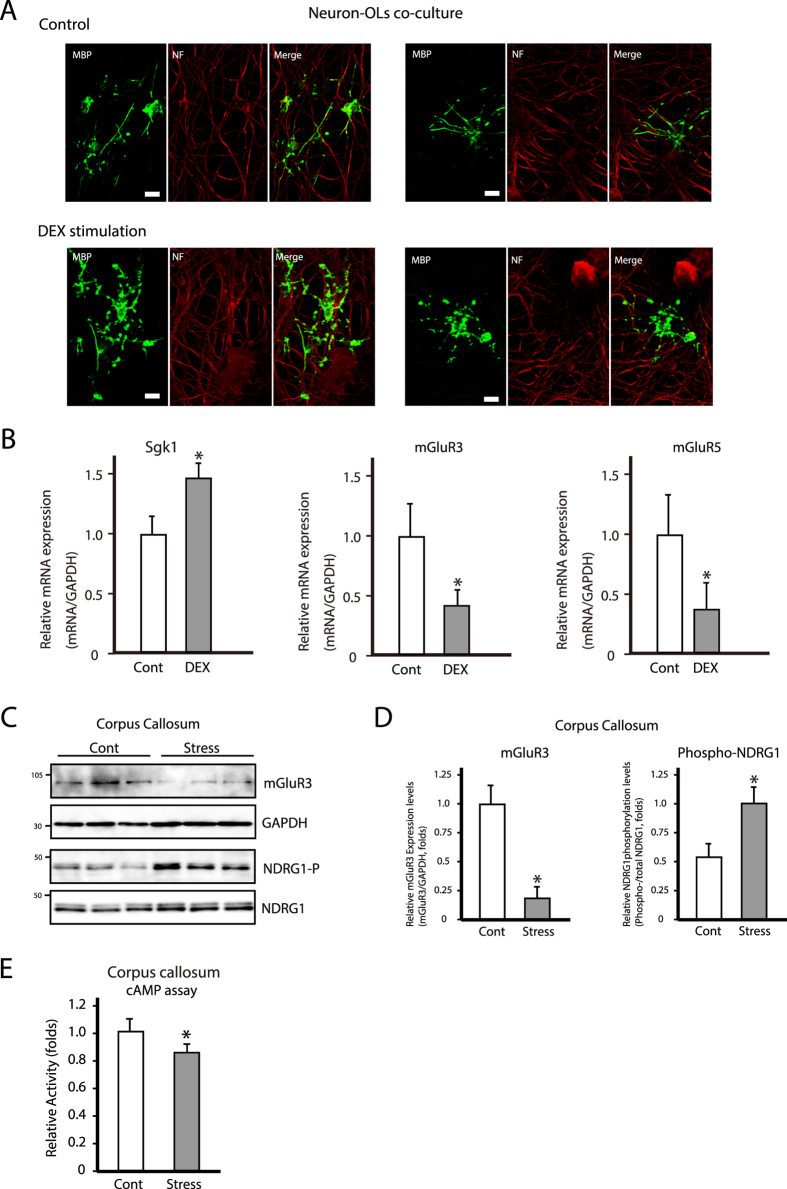
Figure 6. Chronic stress decreases mGluR3 and 5 expressions in a co-culture system and in the corpus callosum, and cAMP level in the corpus callosum.
(A) Representative images of immunocytochemical analysis of Neurofilament (NF) and MBP in oligodendrocyte and DRG-neuron co-culture system after treatment with (Cont) or without (DEX stimulations) 10 μM DEX for 12 hrs. Scale bar = 20 μm. (B) Sgk1, mGluR3, and -5 mRNA expression in co-culture system. Data are expressed as mean ± SEM of at least three independent experiments. *P < 0.05, Student’s t test. (C) Western blot analysis of mGluR3 and phosphorylated NDRG1 (oligodendrocyte stress marker) in the corpus callosum in control (Cont) and chronic stress-exposed (Stress) mice. (D) Quantification of protein bands from (C). Data are expressed as mean ± SEM of at least three independent experiments. *P < 0.05, Student’s t test. (E) cAMP levels in the corpus callosum of control (Cont) and chronically stressed (Stress) mice.

