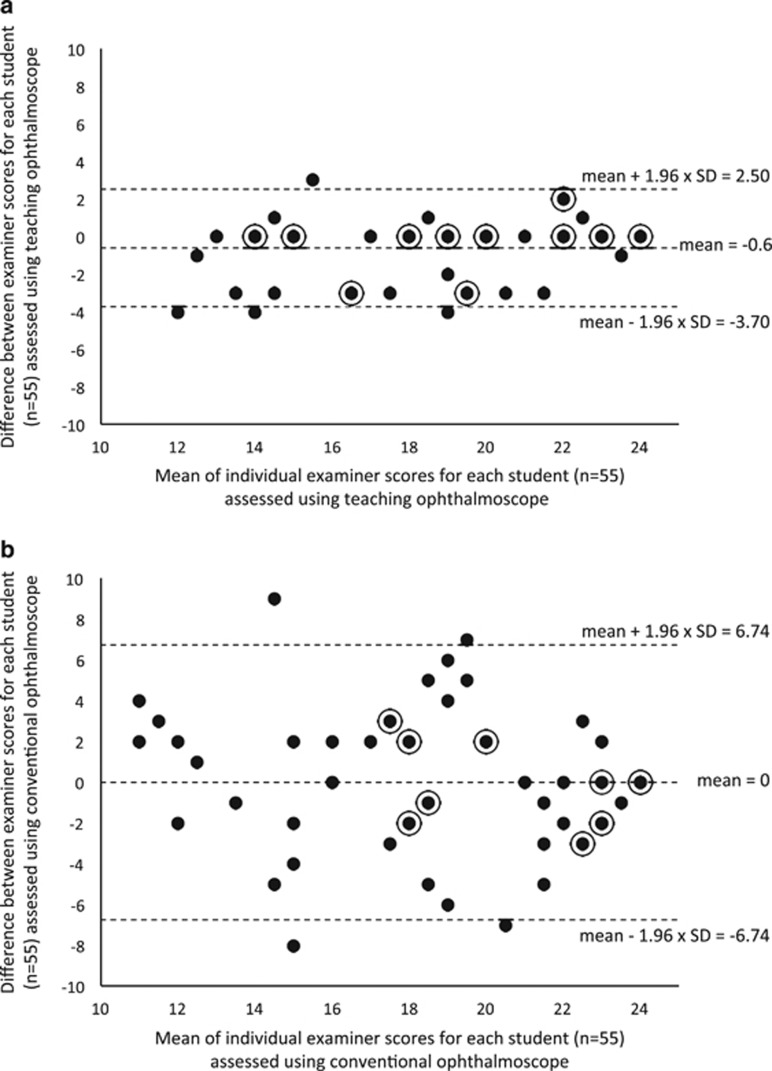
Figure 3.
Comparison of inter-observer (examiner) agreement using the teaching ophthalmoscope (a) and the conventional ophthalmoscope (b) as an assessment tool. Data is presented using the Bland–Altman method with the mean examiner score for each student plotted against the difference between examiner scores. The plots include all students from both the control group and the intervention group (n=55). Dashed lines represent the mean difference in examiner scores and the 95% levels of agreement. Circled points highlight multiple (2 or more) observations at the same point.

