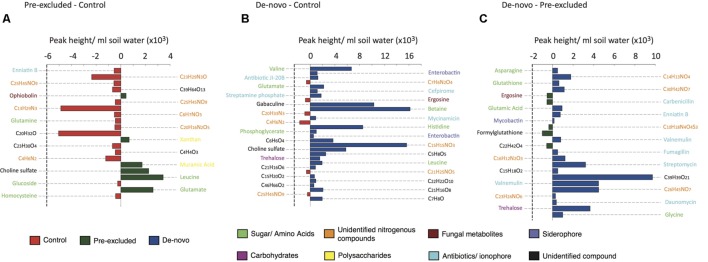
FIGURE 2.
Comparative abundance and putative identification of the top 20 key metabolites statistically differentiating the control and drought sites. Individual panels show the pairwise analysis between (A) control plots and pre-excluded plots, (B) control plots and de-novo plots, and (C) pre-excluded plots and de-novo plots. The bars are coded by site (control, re-excluded, and de novo), and the broad classes of the different compounds are color-coded.

