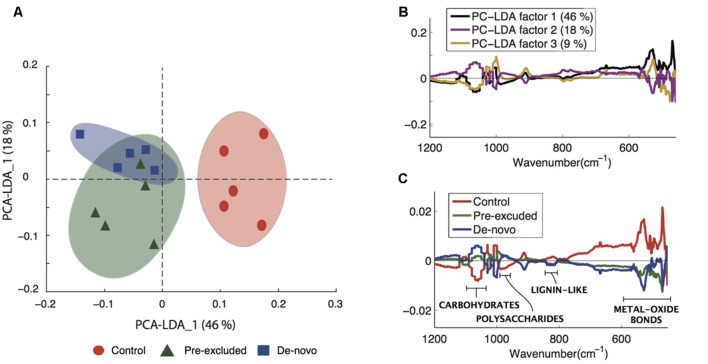
FIGURE 3.
Changes to carbon composition in treatment vs. control soils. (A) principal components analysis (PCA)-linear discriminant analysis (LDA) of the complete Fourier Transform Infrared (FTIR) spectra differentiating control and treatment soils. (B) The first three PCA-LDA loadings of the complete data set in the lower spectral region (≤1200 cm-1) showing the regions that discriminated across the two axis given in (C). (C) Infrared spectra depicting the control and treatment soils, the spectral features have been annotated to indicate the different soil compounds relevant to the current study. An extension of this figure with complete annotations is given in the Supplementary Figure S1.

