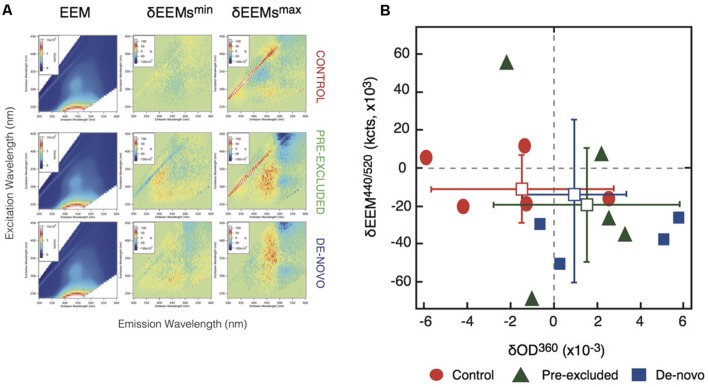
FIGURE 4.
Changes to carbon composition measured using Excitation-Emission matrix (EEM) spectroscopy. (A) Scatter plots representing the correlations between changes in the optical absorption and emission data. Vertical axis is the difference in the EEM region centered at λex = 440 nm and λem = 520 nm (i.e., the blue regions in Figure 3A). Horizontal axis is the difference in UV-vis absorption at 360 nm. (B) Excitation-emission matrix (EEM) analysis of control and excluded soils. Column 1 summarizes averaged EEM data for one replicate series of five extractions from each soil. Columns 2 and 3 report difference EEM (δEEM) data obtained by subtracting the averaged EEM from the control site from a selected individual EEM. Shown are the individual δEEM data that exhibited the smallest (column 2) and largest (column 3) differences from the averaged control. In-figure inserts show pixel intensity values (Column 1 = ×106; Column 2 = ×103).

