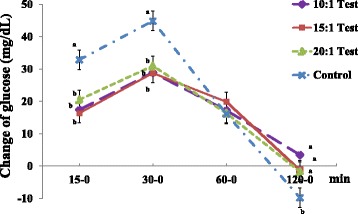
Fig. 2.

Comparisons of changes in serum glucose levels in normal subjects. Values are expressed as the means ± SEM. p-value tested using one-way analysis of variance (ANOVA) and Bonferroni methods

Comparisons of changes in serum glucose levels in normal subjects. Values are expressed as the means ± SEM. p-value tested using one-way analysis of variance (ANOVA) and Bonferroni methods