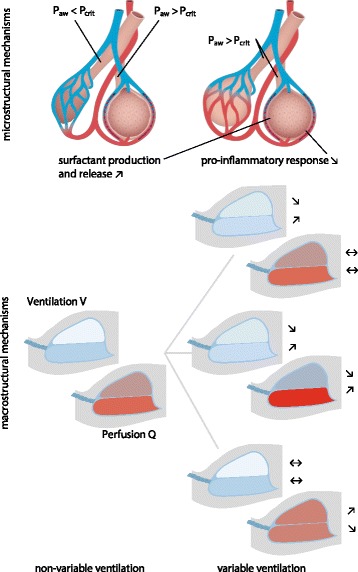
Fig. 3.

Microstructural (top) and macrostructural (bottom) mechanisms of variable ventilation (right side) compared to non‐variable counter‐parts (left side), with distribution of perfusion (red) and distribution of ventilation (white) within the non‐dependent (upper half) and dependent (lower half) parts of the lung; arrows indicate increase (↗), decrease (↘) and unchanged (↔) ventilation/perfusion in the respective lung region. Paw: airway pressure; Pcrit: critical opening pressure. (© Illustration by Peter Ernst)
