
Fig. 1.
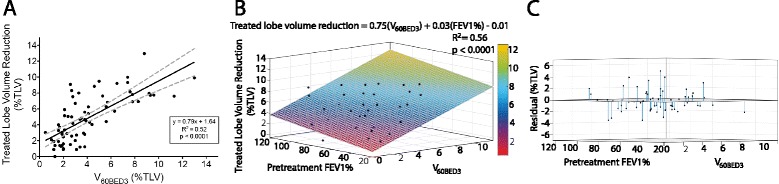
Treated lung volume change after SABR. a Treated lobe volume reduction (as % of total lung volume [TLV]) versus V60BED3 (% of TLV receiving a biologically effective dose ≥60 Gy). The significant linear correlation (black) indicates a dose-volume response relationship (95 % CI, dashed-gray). b Multivariable model (n = 64) comparing treated lobe volume reduction with V60BED3 and pretreatment FEV1%. c Residual plot of the same multivariable model demonstrating goodness of fit