Fig. 4.

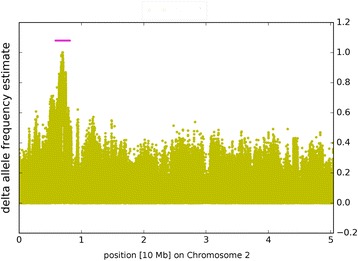
Plot of delta-AFe values for chromosome 2. The delta-AFe values, indicated by yellow dots, clearly show a skew in the AFe values of the two pools. The pink line indicates the ad-hoc identified interval surrounding the peak

Plot of delta-AFe values for chromosome 2. The delta-AFe values, indicated by yellow dots, clearly show a skew in the AFe values of the two pools. The pink line indicates the ad-hoc identified interval surrounding the peak