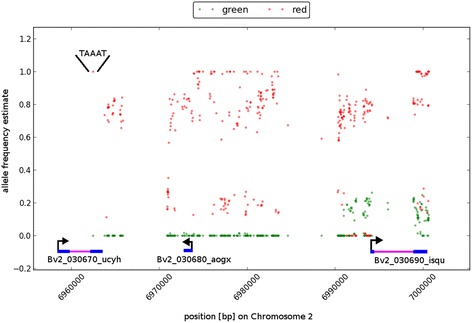
Fig. 5.

Plot of AFe and delta-AFe values for the genetic interval detected. AFe values of the variants detected in the identified interval were plotted for the ‘red’ and the ‘green’ superpool, with a red dot on top of a green one if both were at an identical spot. The intron/exon structure of genes (exons blue, intron pink) overlapping the interval are depicted at the bottom of the figure. The InDel bases present in the sequences of the 'green' pool and absent from the sequences of the 'red' pool are shown in the upper left area. This InDel affects the gene Bv2_030670_ucyh which is the RED gene. Note that the accession KWS2320 from which the reference sequence has been derived was green and genotypically rr
