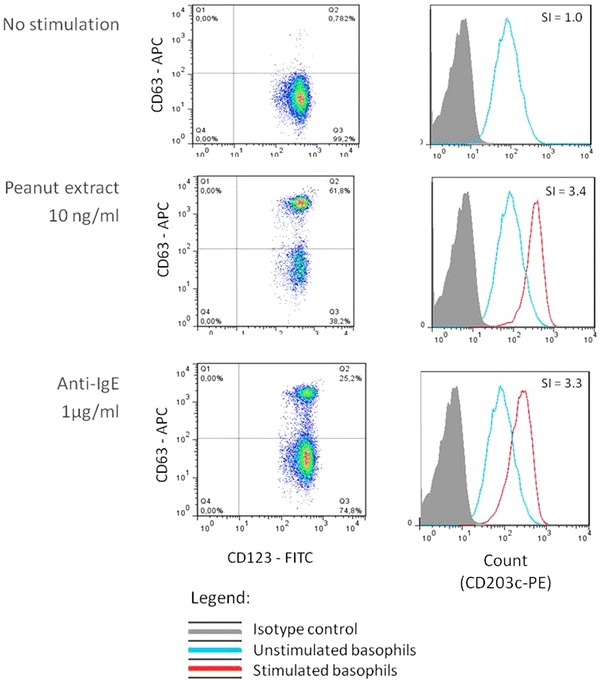
Fig. 2.

Dot plots and histograms showing the expression of CD63 and CD203c on the surface of basophils in different conditions. Unstimulated cells (negative control) and cells stimulated with peanut or with anti-IgE (positive control) are represented. The expression of CD63 is measured as the percentage of positive basophils (left panel) and the expression of CD203c is measured as the stimulation index (SI), i.e. the ratio of the mean fluorescence intensity of stimulated cells and the negative control (right panel)
