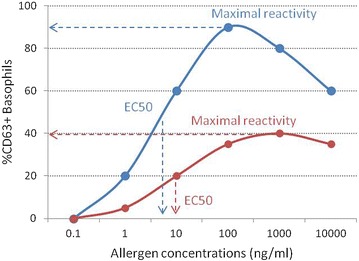
Fig. 3.

Basophil reactivity and basophil sensitivity. Two examples of dose–response curves of basophil activation following stimulation with various concentrations of allergen from two different patients are represented. The proportion of CD63+ positive cells is a measure of basophil reactivity and EC50, the effective concentration at 50 % of the maximal activation, is a measure of basophil sensitivity
