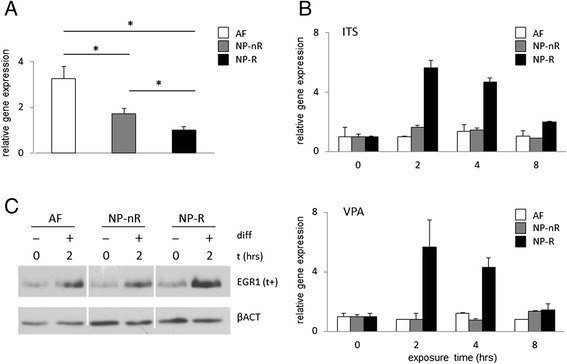
Fig. 1.

Induction of EGR1 expression in IVD cell lines. a Basal expression of EGR1 mRNA in representative clones (AF-123, NP-nR 105 and NP-R 115). Gene expression was normalized to Cyclophillin B and is presented relative to the NP-R clone. b Insulin, Transferrin and selenite (ITS; 10 μg/ml insulin, 10 μg/ml transferrin and 3 × 10⁻⁸M sodium selenite) and Valproic acid (0.3 mM) were used to stimulate IVD cell lines for 0, 2, 4 and 8 h. Gene expression of EGR1 was normalized to Cyclophillin B and is presented relative to the t = 0 time point. Bars represent a biological triplicate. c Protein expression of EGR1 under basal conditions and in response to stimulation with chondrogenic media for two hours. AF, NP-nR and NP-R samples were run on the same gel to allow direct comparison. The indication (t+) points to a long apposition time. Βeta Actin (βACT) was used as loading control; asterisks indicate significantly different expression level; p < 0.05
