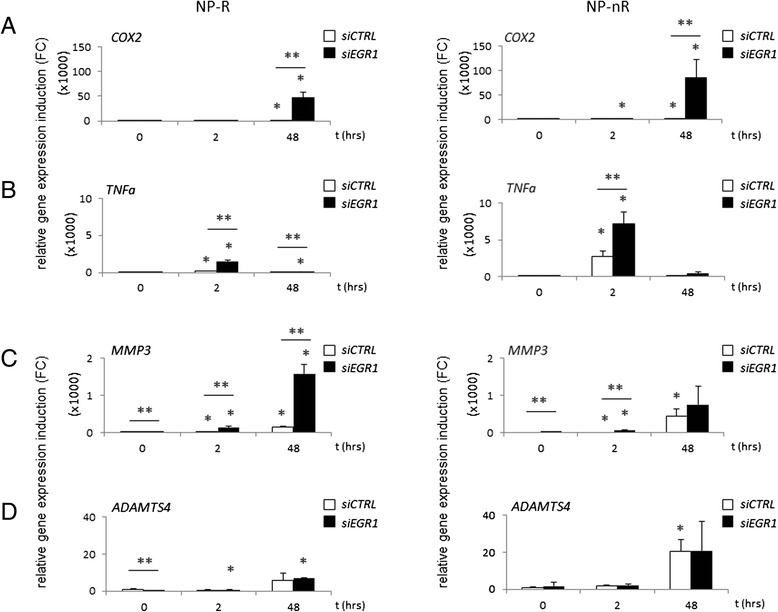
Fig. 4.

EGR1 controls inflammatory responses in IVD cell clones. Induction of COX2 (a) TNFα (b) MMP3 (c) and ADAMTS4 (d) expression measured by qPCR. Sixteen hours after siRNA transfection cells were harvested (time point t = 0) and stimulated with IL-1β for 2 and 48 h. Induced mRNA levels are expressed relative (FC) to siCTRL, t = 0, for each cell type. Double asterisks (**) indicate significantly different expression levels between siCTRL and siEGR1 measurements at the indicated time points (p < 0.05); single asterisks (*) indicate significance (p < 0.05) compared to time point t = 0 of that series (siCTRL or siEGR1)
